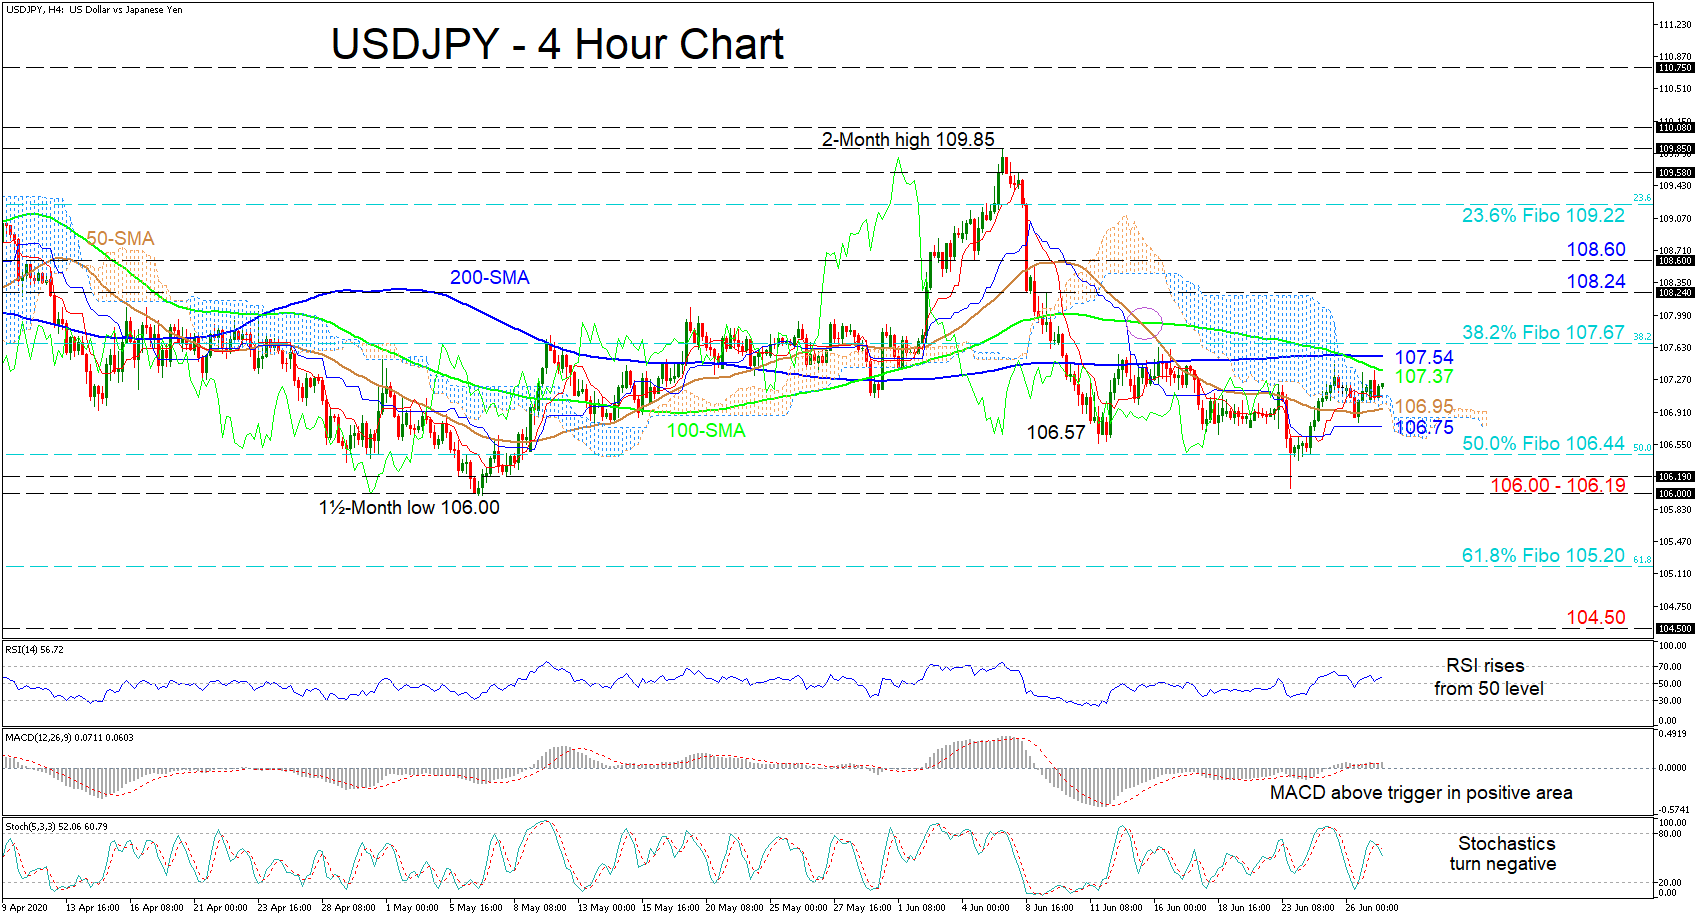
 USDJPY appears to be maintaining a horizontal trajectory trapped between the 200-period simple moving average (SMA) and the 50-period SMA. A paused state of directional momentum is reflected in the Ichimoku lines, while the price rests around the upper surface of the Ichimoku cloud.
The mixed signals in the short-term oscillators further reflect the stall in the price. The MACD has barely inched above its red trigger line in the positive region, while the RSI improves from its neutral mark. However, the stochastic %K line promotes weakness as it has completed a negative overlap with the %D line.
To the upside, emanating pressure over the last couple of weeks has denied upside moves. If buyers manage to jump above the SMAs at 107.37 and 107.54, a revisit of the 107.67 mark could unfold, which is the 38.2% Fibonacci retracement of the up leg from 101.17 – 111.71. Overcoming these constrictions could see resistance develop at the 108.24 swing high, which is in-line with the upper band of the cloud. Another leg up could tackle the inside swing low of 108.60 before meeting the 23.6% Fibo of 109.22.
Otherwise, if sellers drive the pair below the cloud and the 50-period SMA at 106.95, the blue Kijun-sen line at 106.75 could interrupt the pair ahead of the 50.0% Fibo of 106.44. In the event selling interest persists, the key support region of 106.00 – 106.19 could halt the decline. Should it fail to do so, the 61.8% Fibo of 105.20 – residing near the 105.13 trough – could challenge the bears before the price sinks towards the 104.50 trough.
Summarizing, initially the confines of 106.75 or 107.67 would need to be breached to revive directional momentum. Yet, the short-to-medium term picture remains neutral and a break either above 109.85 or below 106.00 would be required to set the next clear course.
Origin: XM


