


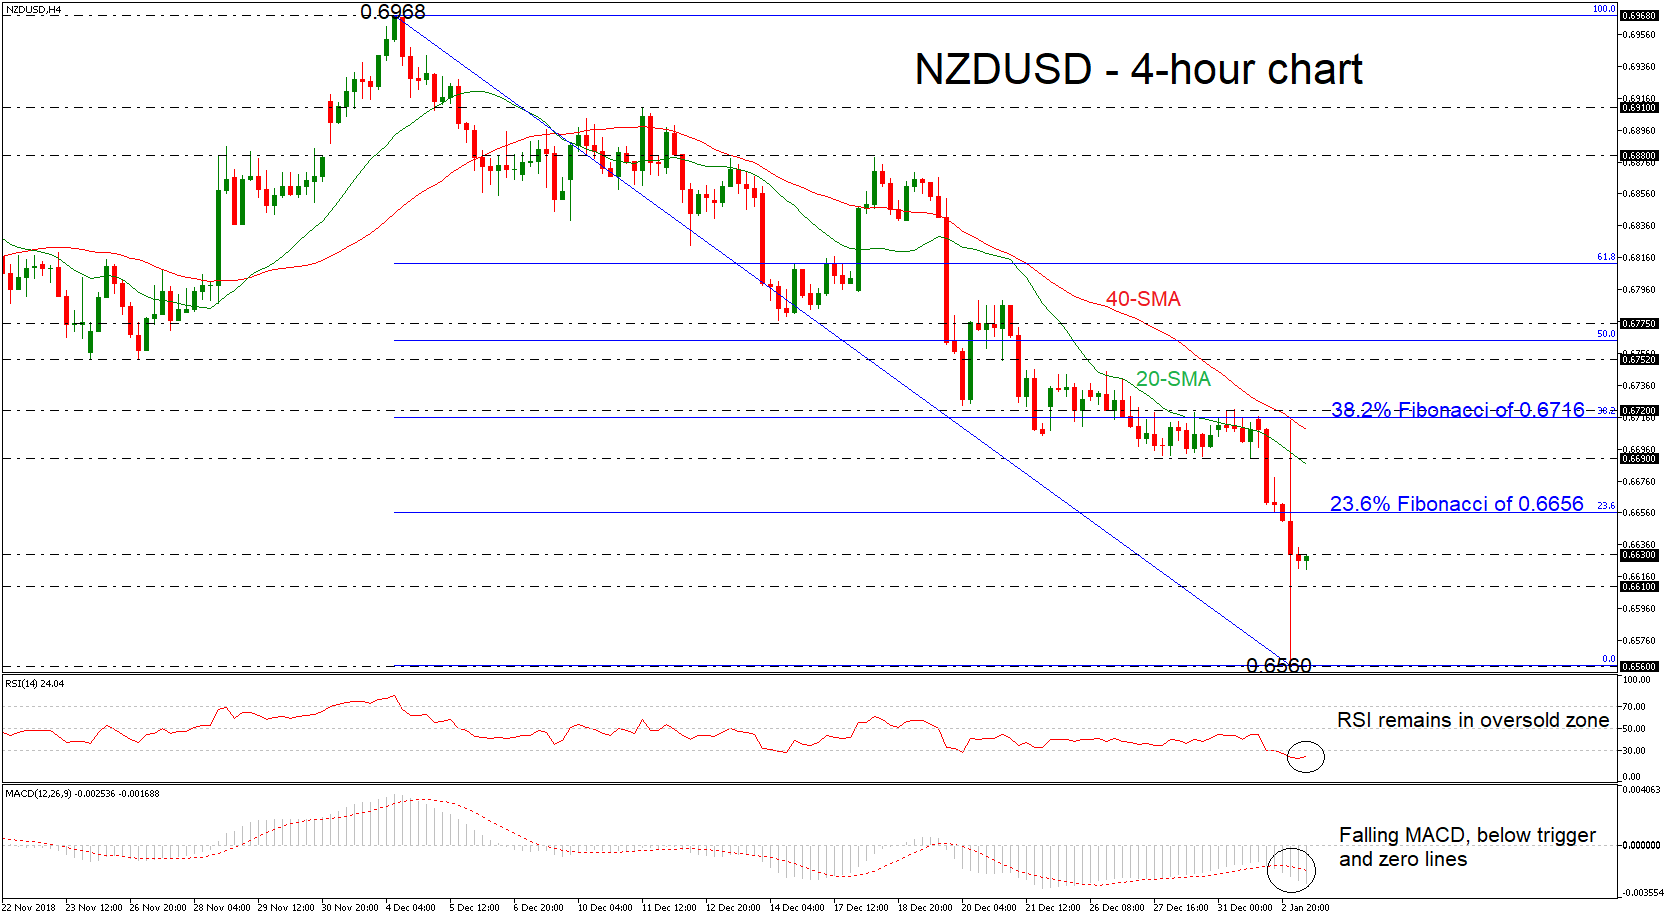
 NZDUSD had a deep fall earlier today, dropping to a fresh two-month low of 0.6560. Currently, the price is trading well above this bottom, paring some of the losses and creating a base below the 20- and 40-simple moving averages (SMAs) in the 4-hour chart. The technical picture supports that the strong sell-off is likely to continue in the short-term.
Looking at momentum indicators, the RSI is lacking direction in the oversold zone, while the MACD oscillator is strengthening its negative movement below the trigger and zero lines.
Should the pair face more negative pressures, the market could meet support at the 0.6610 barrier, before it heads lower to the two-month low. A successful close below this level could see a retest of the October 31 low of 0.6505.
On the flipside, a move to the upside could see immediate resistance at the 23.6% Fibonacci retracement level of the downleg from 0.6968 to 0.6560 around 0.6656. Should the market increase positive momentum above this area, the 20-SMA near 0.6690 could be next the level for investors to focus on. A stronger barrier, though, could be found at the 38.2% Fibonacci of 0.6716.
Overall, NZDUSD has been developing in a downward tendency over the last month, following the bounce off the 0.6968 resistance level.
Origin: XM


