


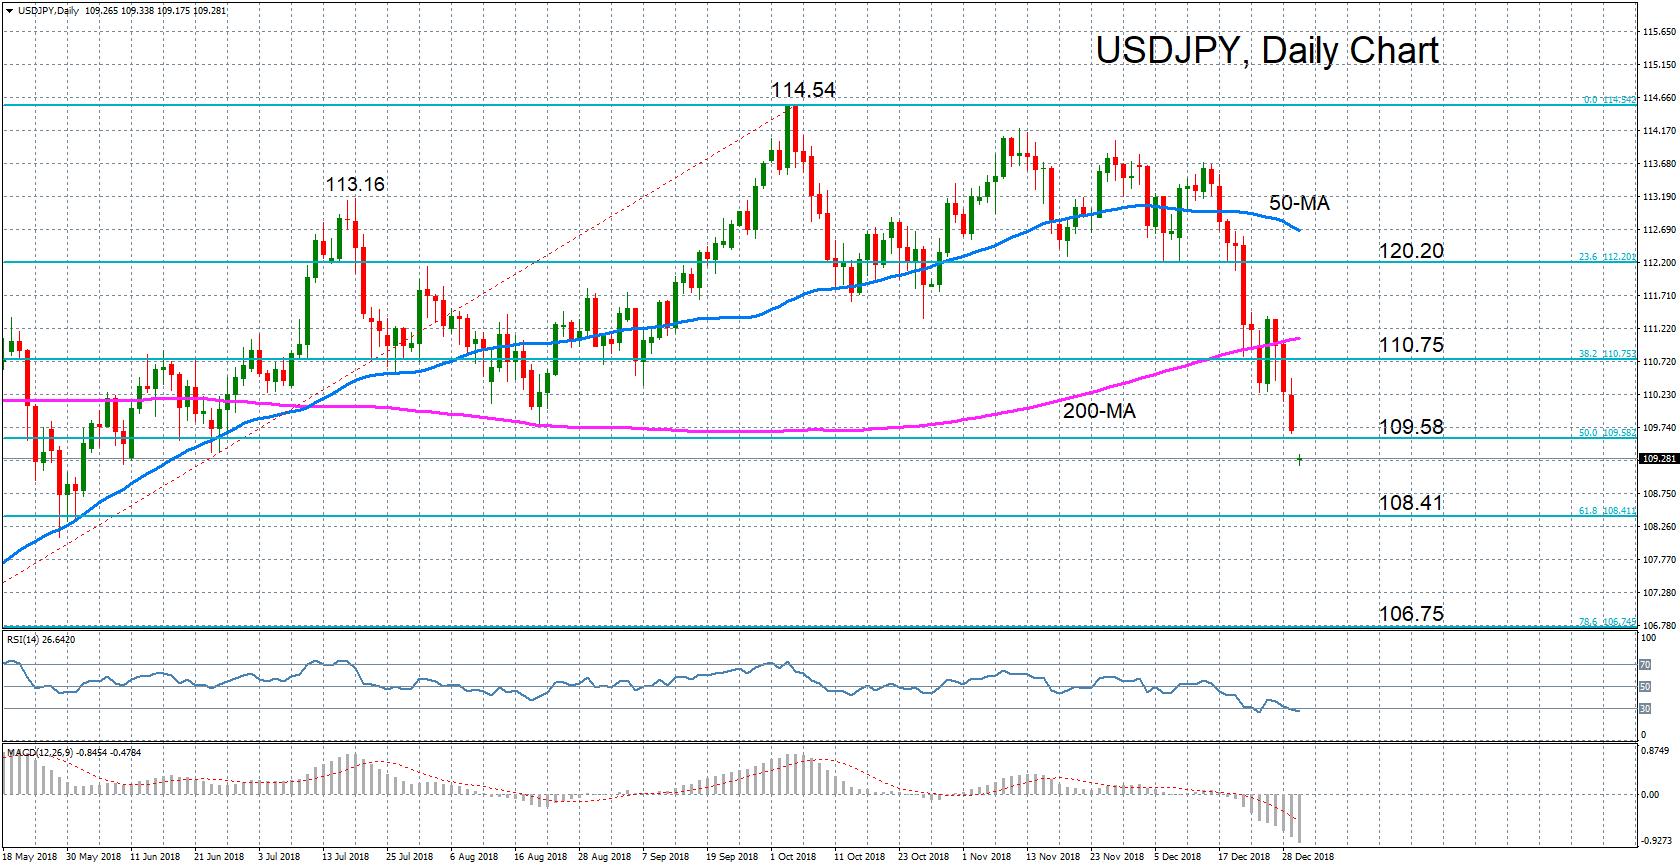
 USDJPY opened with a gap lower on the first trading day of 2019 to fall to a 7-month low of 109.18. The pair is down by about 4.7% from the 11-month high of 114.54 set in October 2018 and has now slipped below both its 50- and 200-day moving averages, erasing its bullish structure in the medium term.
The momentum indicators point to further downside in the near term. The MACD continues to fall deeper into negative territory below its signal line. However, the RSI has just crossed into oversold territory below 30, suggesting an upside correction could be due soon.
Should prices continue to head lower, the next major support probably won’t arrive until the 61.8% Fibonacci retracement level of the upleg from 104.62 to 114.54, at 108.41. A breach of this support would signal a shift to a bearish outlook in the medium term and could accelerate the declines towards the 78.6% Fibonacci retracement at 106.75.
But if USDJPY manages to reverse higher, it is likely to face immediate resistance at the key 50% Fibonacci level at 109.58. A break above this level would strengthen the positive momentum and may drive the price until the 38.2% Fibonacci at 110.75. Further gains could see the 23.6% Fibonacci at 120.20 coming into view. However, the pair would need to aim even higher for the 50-day moving average (currently around 112.68) to eliminate the bearish bias.
Origin: XM


