


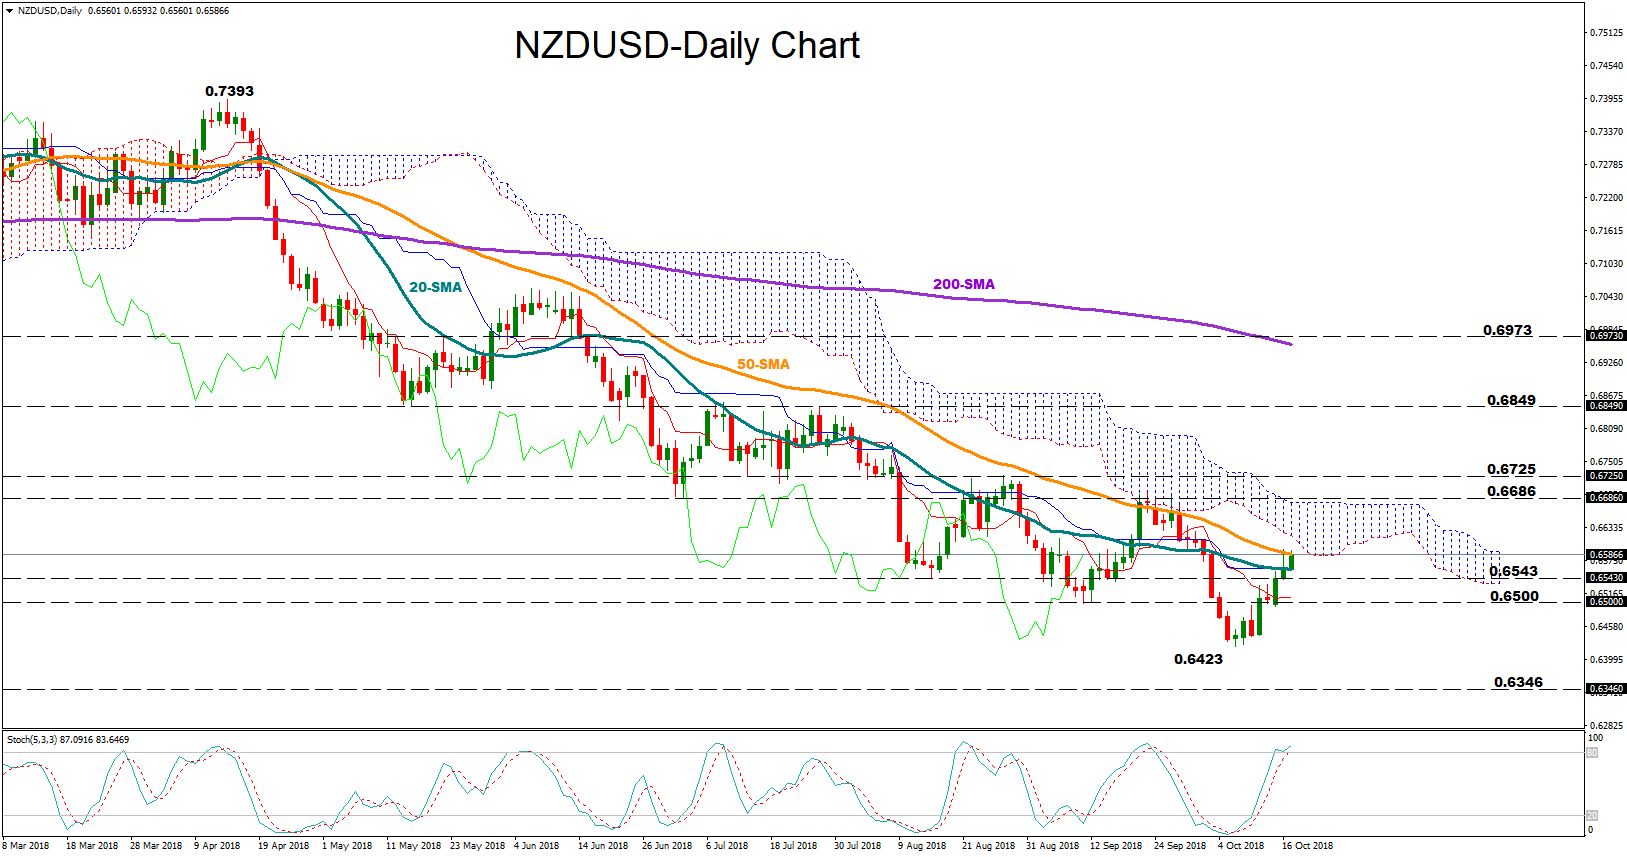
 NZDUSD has been comfortably rising since its drop to a 2 ½ -year low of 0.6423 on October 8. However, the recent upside has not violated the long-term downtrend yet and the pair remains bearish in the bigger picture, maintaining the lower lows and the lower highs off 0.7393 and below the Ichimoku cloud.
In the short-term, Stochastics suggest that the rally is overdone and a reversal to the downside is around the corner as the green %K line is set to meet the red %D line in the overbought territory above 80. Looking at Ichimoku indicators, the red Tenkan-sen line has flattened below the blue Kijun-sen line, supporting that consolidation could also emerge before the price changes direction.
Should the pair extend gains above the 50-day (simple) moving average (MA), resistance is expected to come between 0.6686 and 0.6725, taken from the low on July 3 and the peak on August 28 respectively – the latter has been tested more frequently in the past couple of months. A decisive close above that region and thus above the cloud could trigger stronger bullish actions, sending the price up to 0.6849 which is another familiar zone for the market. Beyond that, traders may speculate that the upward move could continue, targeting the inside swing high of 0.6973 registered on May 22, which is slightly above the 200-day MA.
In the alternative scenario, a dip in the price could revisit the 0.6543 trough before stopping around the 0.65 round level. Beneath the latter, it would be interesting to see whether bears can unlock fresh lows below 0.6423 in which case support could run until 0.6346, the January 2016 bottom.
Origin: XM


