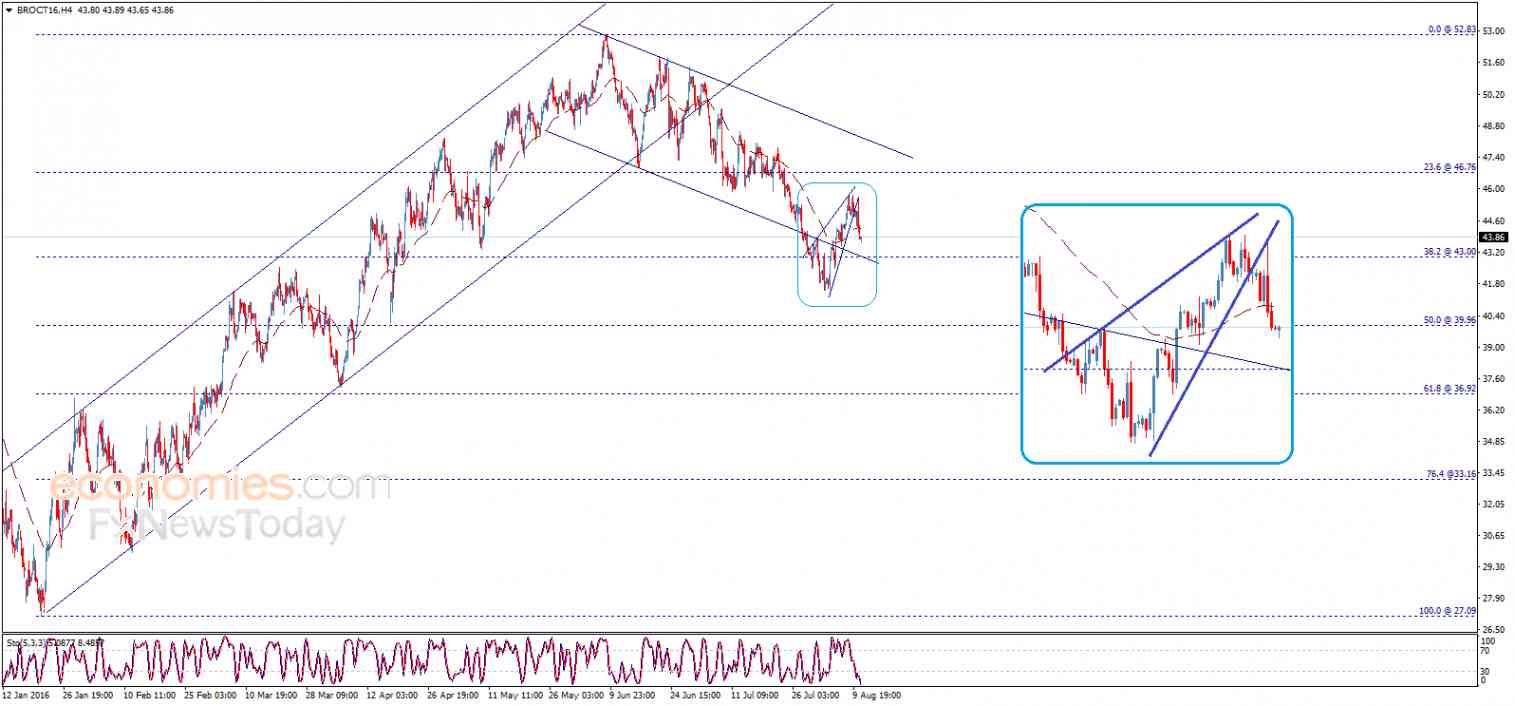
 Brent oil price declined strongly yesterday after completing the rising wedge pattern that appears on the above chart, to surpass the EMA50 and approach from the key support 43.00, which puts the price under potential negative pressure in the upcoming period, it might lead to break the mentioned support followed by pushing the price to suffer more losses.
On the other hand, stochastic shows clear oversold signals now, to provide positive factor that might assist to protect trading above the above mentioned support followed by pushing the price to resume the main bullish trend again.
Therefore, this contradiction between the technical factors makes us prefer staying aside temporarily in order to monitor the price behavior according to the key levels represented by 43.00 support and 44.25 resistance, as breaching this resistance represents positive factor that will allow the price to regain its bullish track that its next target located at 46.76, while breaking 43.00 support will push trading to target 50% Fibonacci level for the rise measured from 27.09 to 52.83, located at 39.96.
Expected trading range for today is between 41.50 support and 46.00 resistance.
Expected trend for today: Depends on the above mentioned levels
Origin: Economies