 On Monday, Trump announced a doubling of tariffs on steel and aluminium imports starting Wednesday. This move and his claim that China breached the May 12 trade agreement added to geopolitical risk and supported AUD/USD. On the other hand, the chart below shows that the ISM Manufacturing PMI dropped to 48.5 in May 2025.
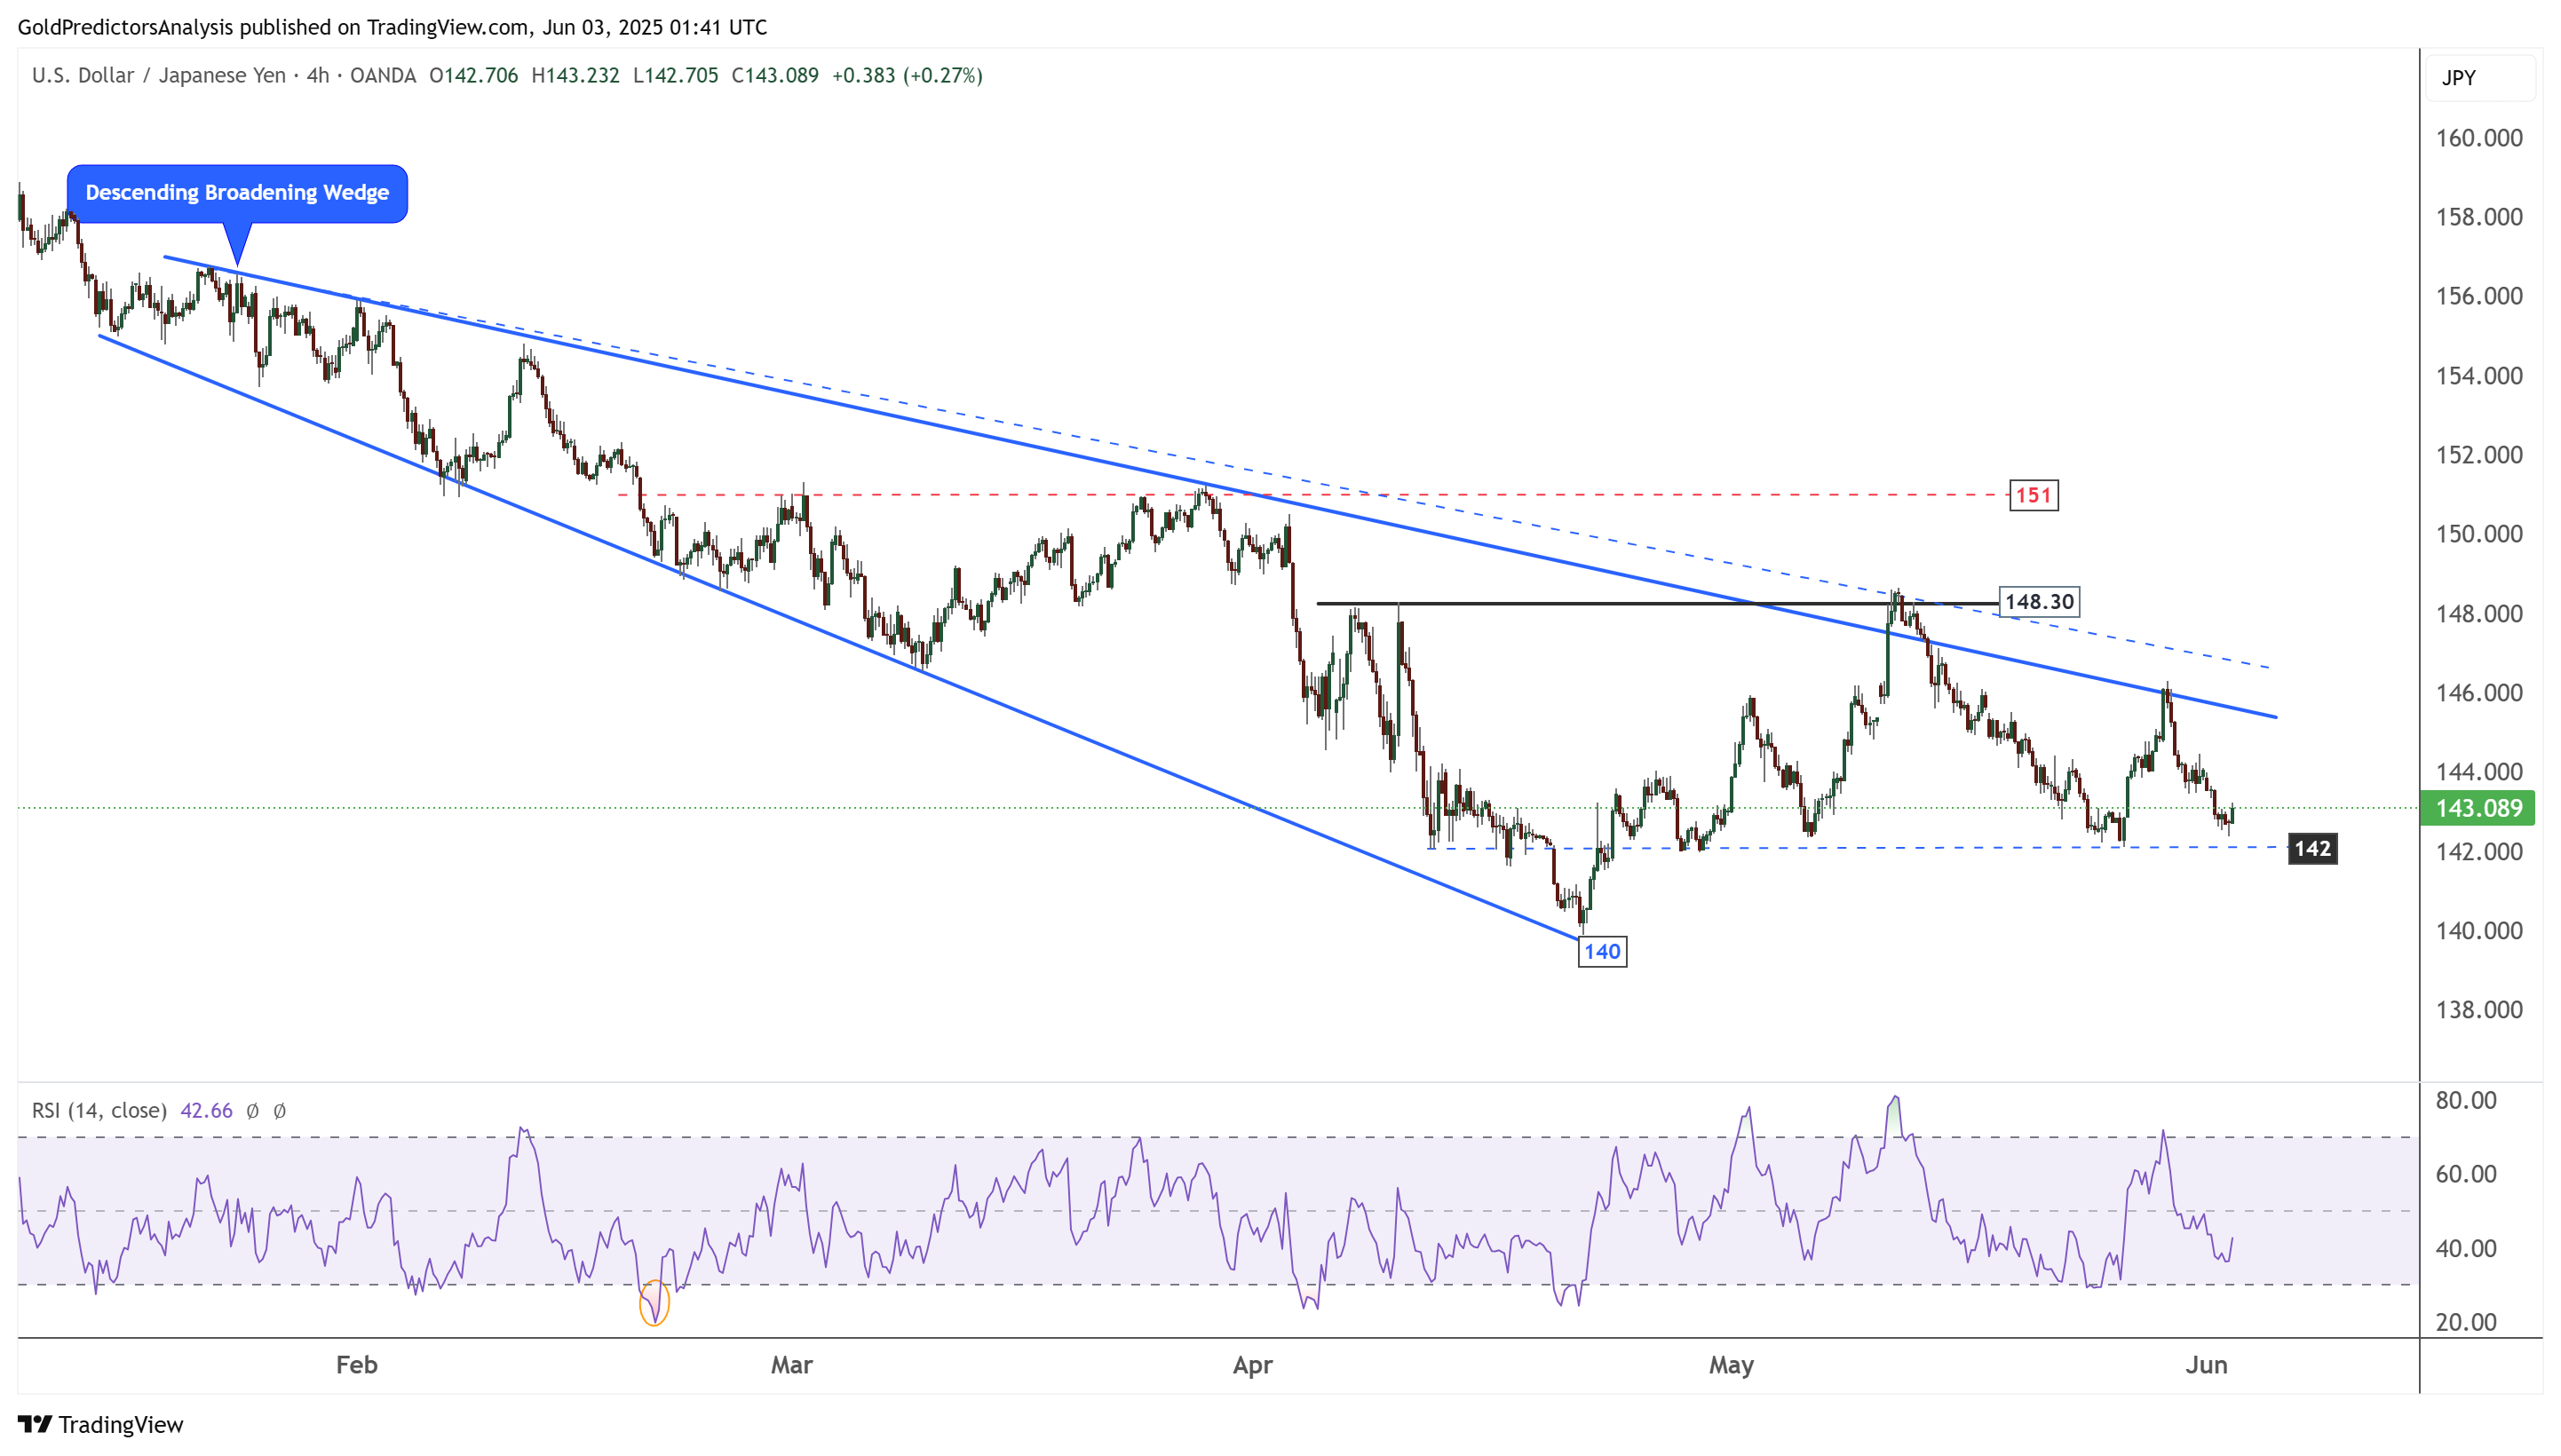
The 4-hour chart for USD/JPY shows that the pair is trading within a descending broadening wedge pattern and forming bearish price action. The failure to break above 148.30 suggests the pair is preparing for the next move to the downside. A break below the blue dotted trend line at 142 would signal a strong breakdown toward the 140 area. Moreover, a break below 140 would confirm strong bearish momentum.