 NZD/USD Technical Analysis – Broadening Wedge Pattern
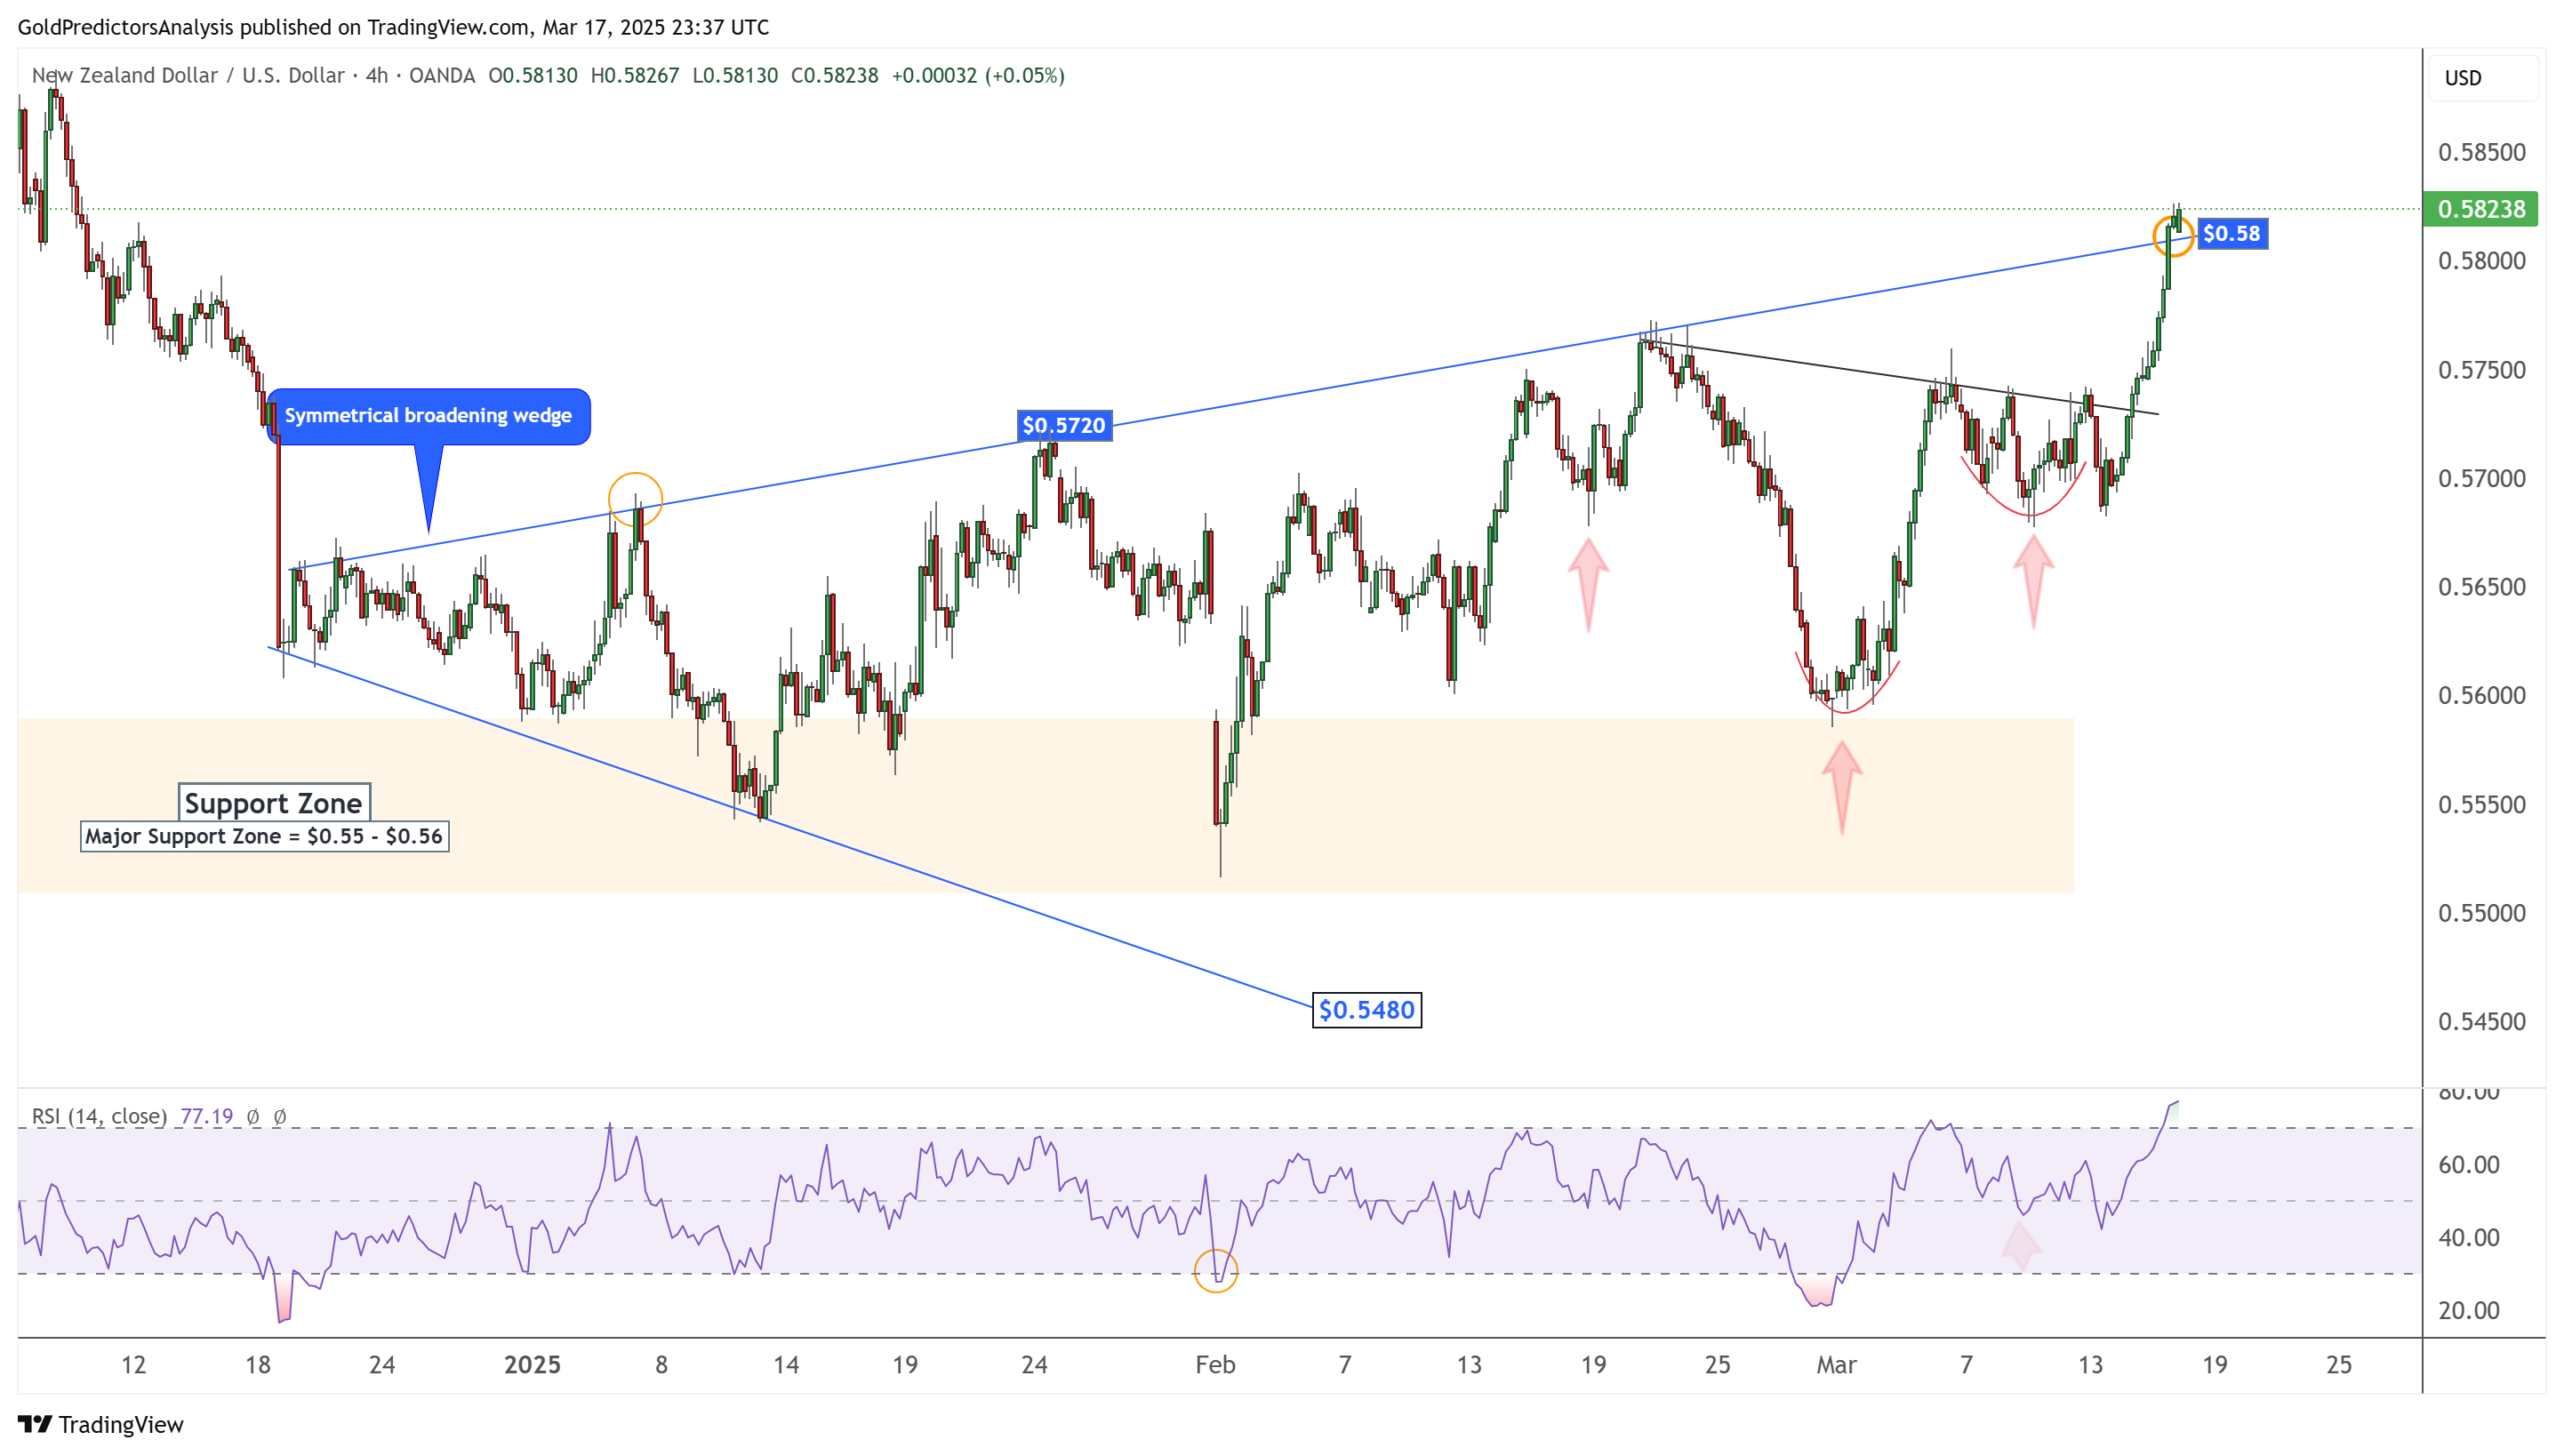
The 4-hour chart for NZD/USD shows that the price has broken out of the symmetrical broadening wedge pattern and is moving higher. The price has also formed a rounding bottom pattern, similar to AUD/USD. A break above $0.58 has opened the door for further upside.
However, the RSI indicates overbought conditions, suggesting a potential correction before the next move is higher.