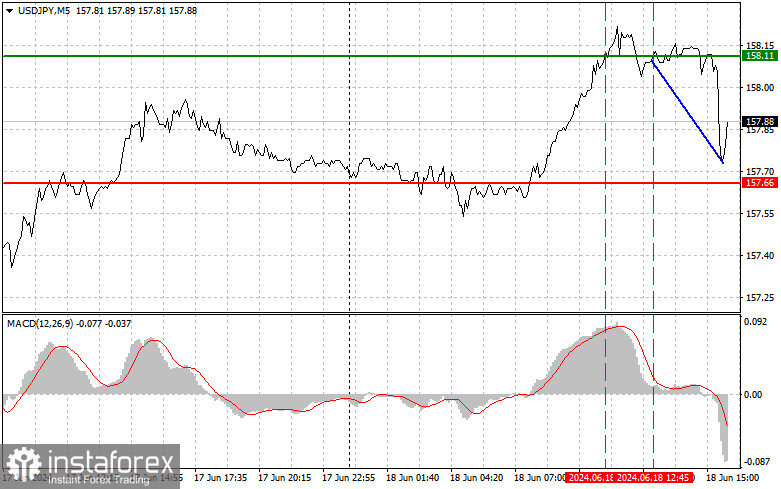
 Analysis of Trades and Tips for Trading the Japanese YenThe first test of the 158.11 price level occurred when the MACD indicator was overbought, indicating the potential for Scenario #2 to sell the dollar. As a result, the pair fell by more than 30 points. In the second half of the day, there is a lot of data that could put additional pressure on the dollar. We expect reports on US retail sales, industrial production, and manufacturing production. Poor performance in these areas would provide another reason to sell, especially as the pair is near its yearly high. Weak statistics are unlikely to break through such a strong level and increase USD/JPY. Regarding the intraday strategy, I plan to act based on implementing Scenarios #1 and #2.
Buy SignalScenario #1: Today, I plan to buy USD/JPY upon reaching the entry point around 158.20 (green line on the chart) with a target of rising to the 158.67 level (thicker green line on the chart). Around 158.67, I will exit the buy positions and open sell positions in the opposite direction (expecting a 30-35 point movement in the opposite direction from this level). The pair’s growth today can only be expected after strong US data. Important! Before buying, ensure that the MACD indicator is above the zero mark and starting to rise.Scenario #2: I also plan to buy USD/JPY today for two consecutive tests of the 157.66 price level when the MACD indicator is in the oversold area. This will limit the pair’s downward potential and lead to a market reversal upwards. Growth to the opposite levels of 158.20 and 158.67 can be expected.Sell SignalScenario #1: Today, I plan to sell USD/JPY after breaking the 157.66 level (red line on the chart), leading to a quick decline of the pair. The key target for sellers will be the 157.05 level, where I will exit the sell positions and open buy positions in the opposite direction (expecting a 20-25 point movement in the opposite direction from this level). Selling pressure will return in the case of unsuccessful attempts to reach the daily high and dovish comments from the Fed representatives. Important! Before selling, ensure that the MACD indicator is below the zero mark and just starting to fall from it.Scenario #2: I also plan to sell USD/JPY today for two consecutive tests of the 158.20 price level when the MACD indicator is overbought. This will limit the pair’s upward potential and lead to a downward market reversal. A decline to the opposite levels of 157.66 and 157.05 can be expected.
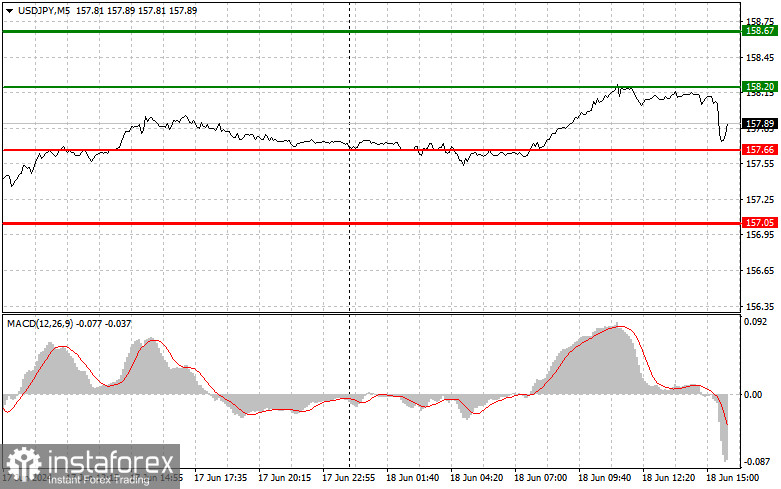
Chart Explanation: Thin Green Line: Entry price for buying the trading instrument. Thick Green Line: The anticipated price where Take Profit can be set, or profits can be manually fixed, as further growth above this level is unlikely. Thin Red Line: Entry price for selling the trading instrument. Thick Red Line: The anticipated price at which Take Profit can be set, or profits can be manually fixed, as further decline below this level is unlikely.
Origin: InstaForex


