Русский


 WTI crude oil (CL) prices rebound from the support levels to around $63 per barrel. This price increase comes after hitting a four-year low. However, prices remain below the breakeven points for many US producers. According to the Dallas Fed, drillers need around $65 to profitably start a new well. Rystad Energy estimates that producers require at least $62 to cover debts and dividends.
Despite this short-term increase, the prices remain under bearish pressure below the long-term support area. The breakdown from the long-term support reflects fears of weakening global demand. The trade war between the US and China has intensified, with a 104% tariff now imposed on Chinese imports. China, the world’s top oil consumer, could see demand growth of 50,000 to 100,000 barrels per day at risk.
Moreover, pressure comes from supply-side developments. OPEC+ plans to increase production by 411,000 barrels per day in May, raising concerns of a market surplus. Meanwhile, US crude inventories dropped by 1.057 million barrels last week, but this was not enough to counteract the previous 6.037 million barrel build.
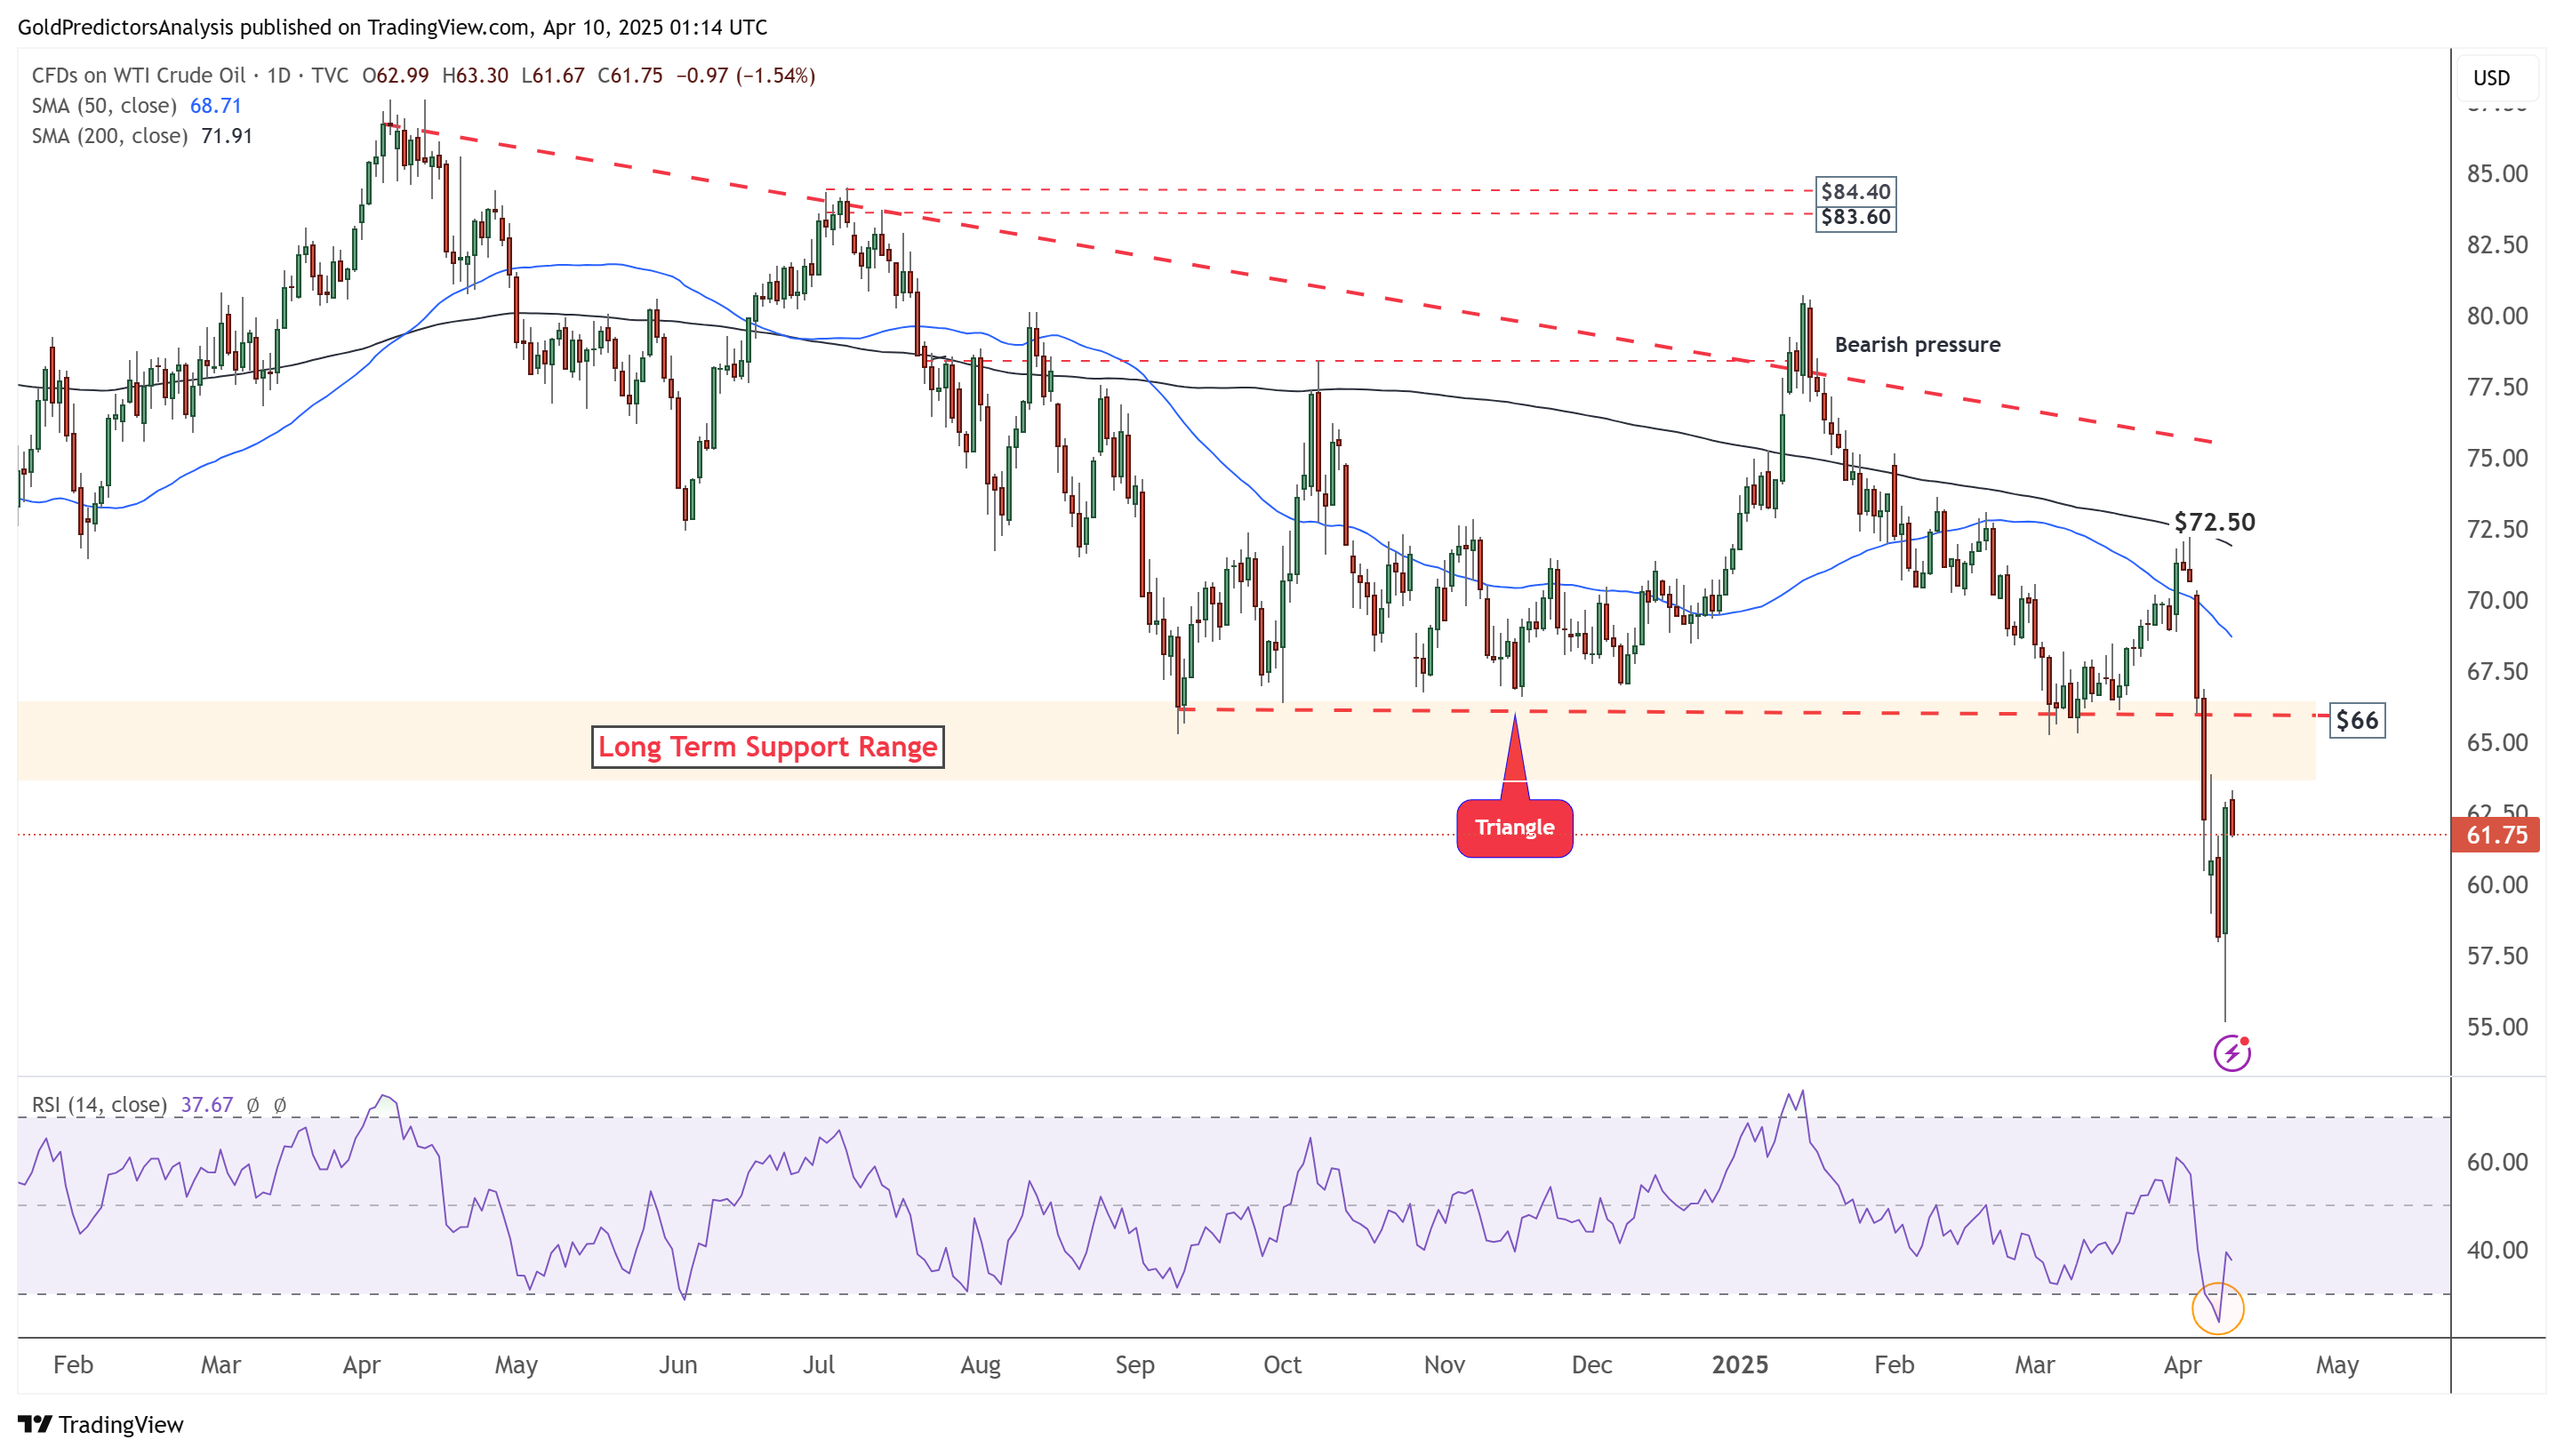
Oil Daily Chart – Bullish Hammer
The daily chart for WTI crude oil shows that the price broke out of the triangle pattern and hit $55.15. However, this drop was reversed, forming a bullish hammer candle on Wednesday. Despite the reversal, the price failed to close above $66, which keeps bearish pressure intact. The immediate resistance for WTI crude oil is between $65 and $66, and a weekly close above this range is needed to negate the bearish outlook.
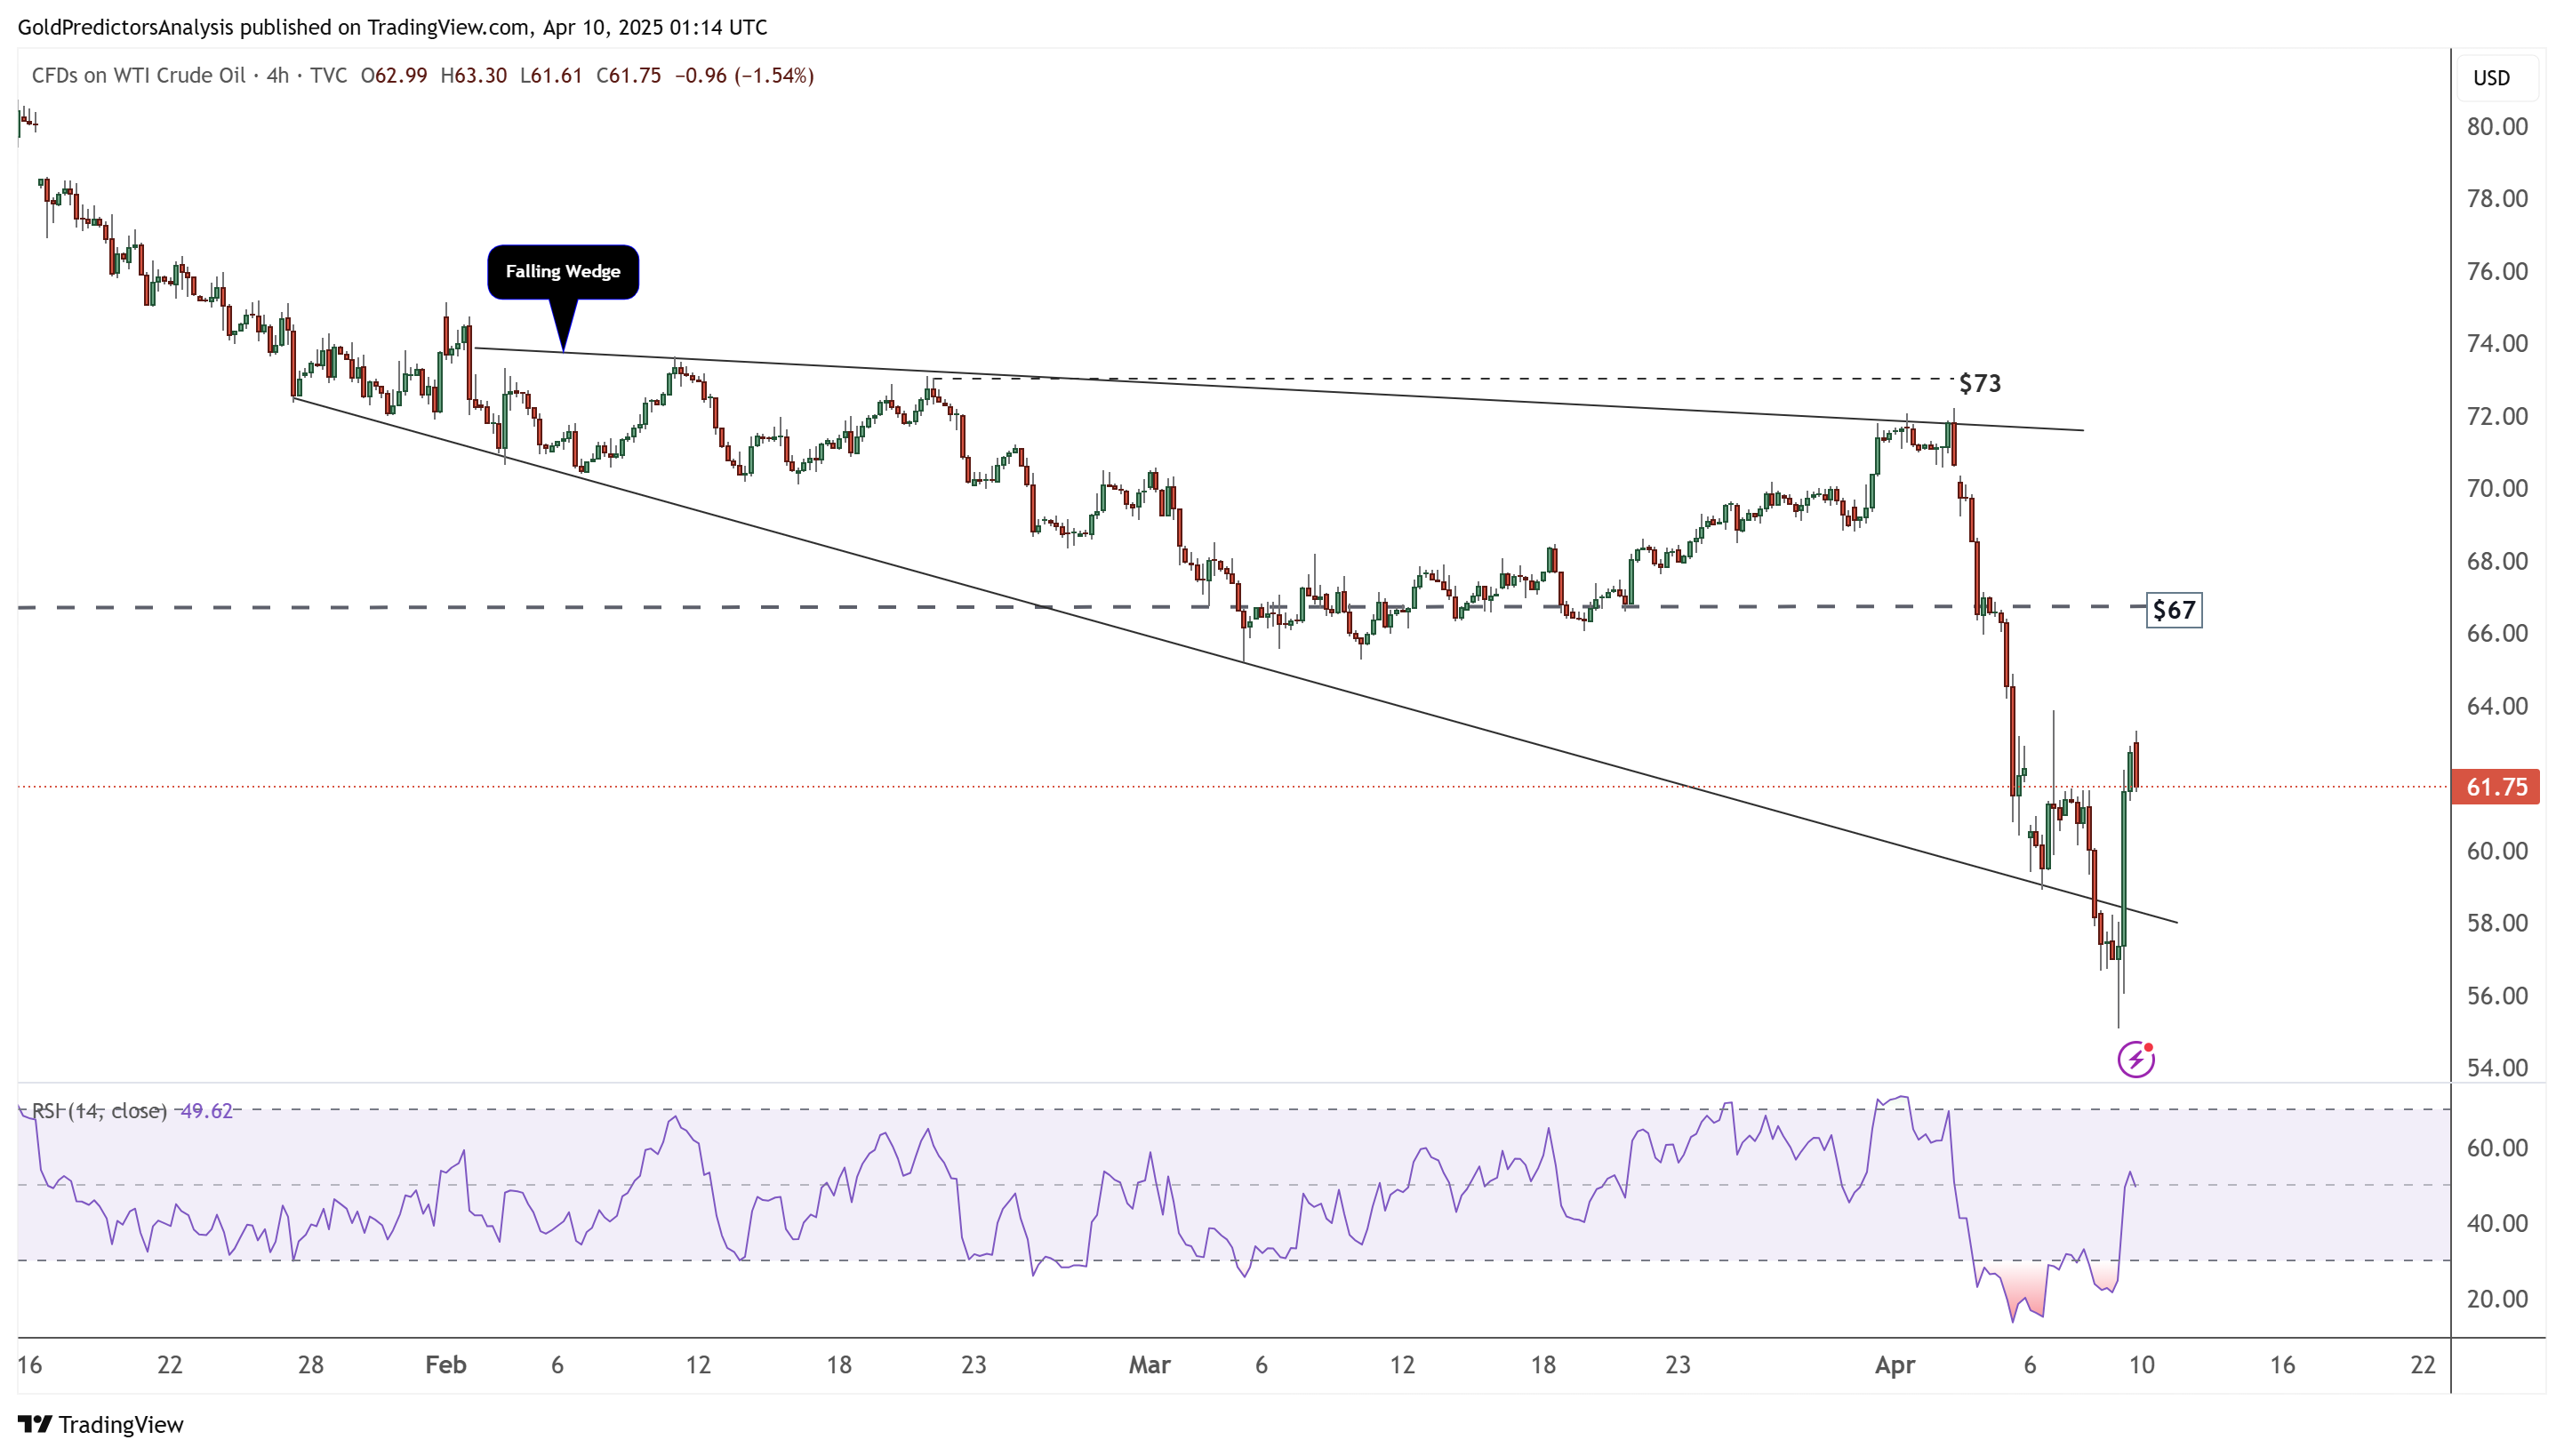
Oil 4-Hour Chart – Volatility
The 4-hour chart shows that the price has reached the support zone of the falling wedge pattern around the $55 area, where it remains volatile. The strong rebound from this level is due to extremely oversold conditions observed in the RSI. The immediate resistance for this rebound remains in the $65 to $67 area.