Русский


 This improvement reflects resilience in China’s service sector, offering some support to the Australian Dollar. However, the rebound was limited as markets reacted to President Trump’s sweeping tariff plan. The US imposed a 10% baseline tariff on all imports and added harsh duties—up to 54%—on goods from 60 countries, including China. As China is Australia’s largest trading partner, fears of a global trade slowdown added to AUD selling pressure.
Moreover, weak trade data added further pressure on the Aussie. The chart below shows that Australia’s trade surplus fell to 2,968M AUD in February, well below the expected 5,600M and January’s revised figure of 5,156 M. This decline signals weakening external demand and weighs on the Australian economy. Meanwhile, concerns over the US economy could limit USD strength. Traders now await the US Initial Jobless Claims, S&P Services PMI, and ISM Services PMI. Weaker results could reduce USD demand and provide short-term support to AUD/USD.
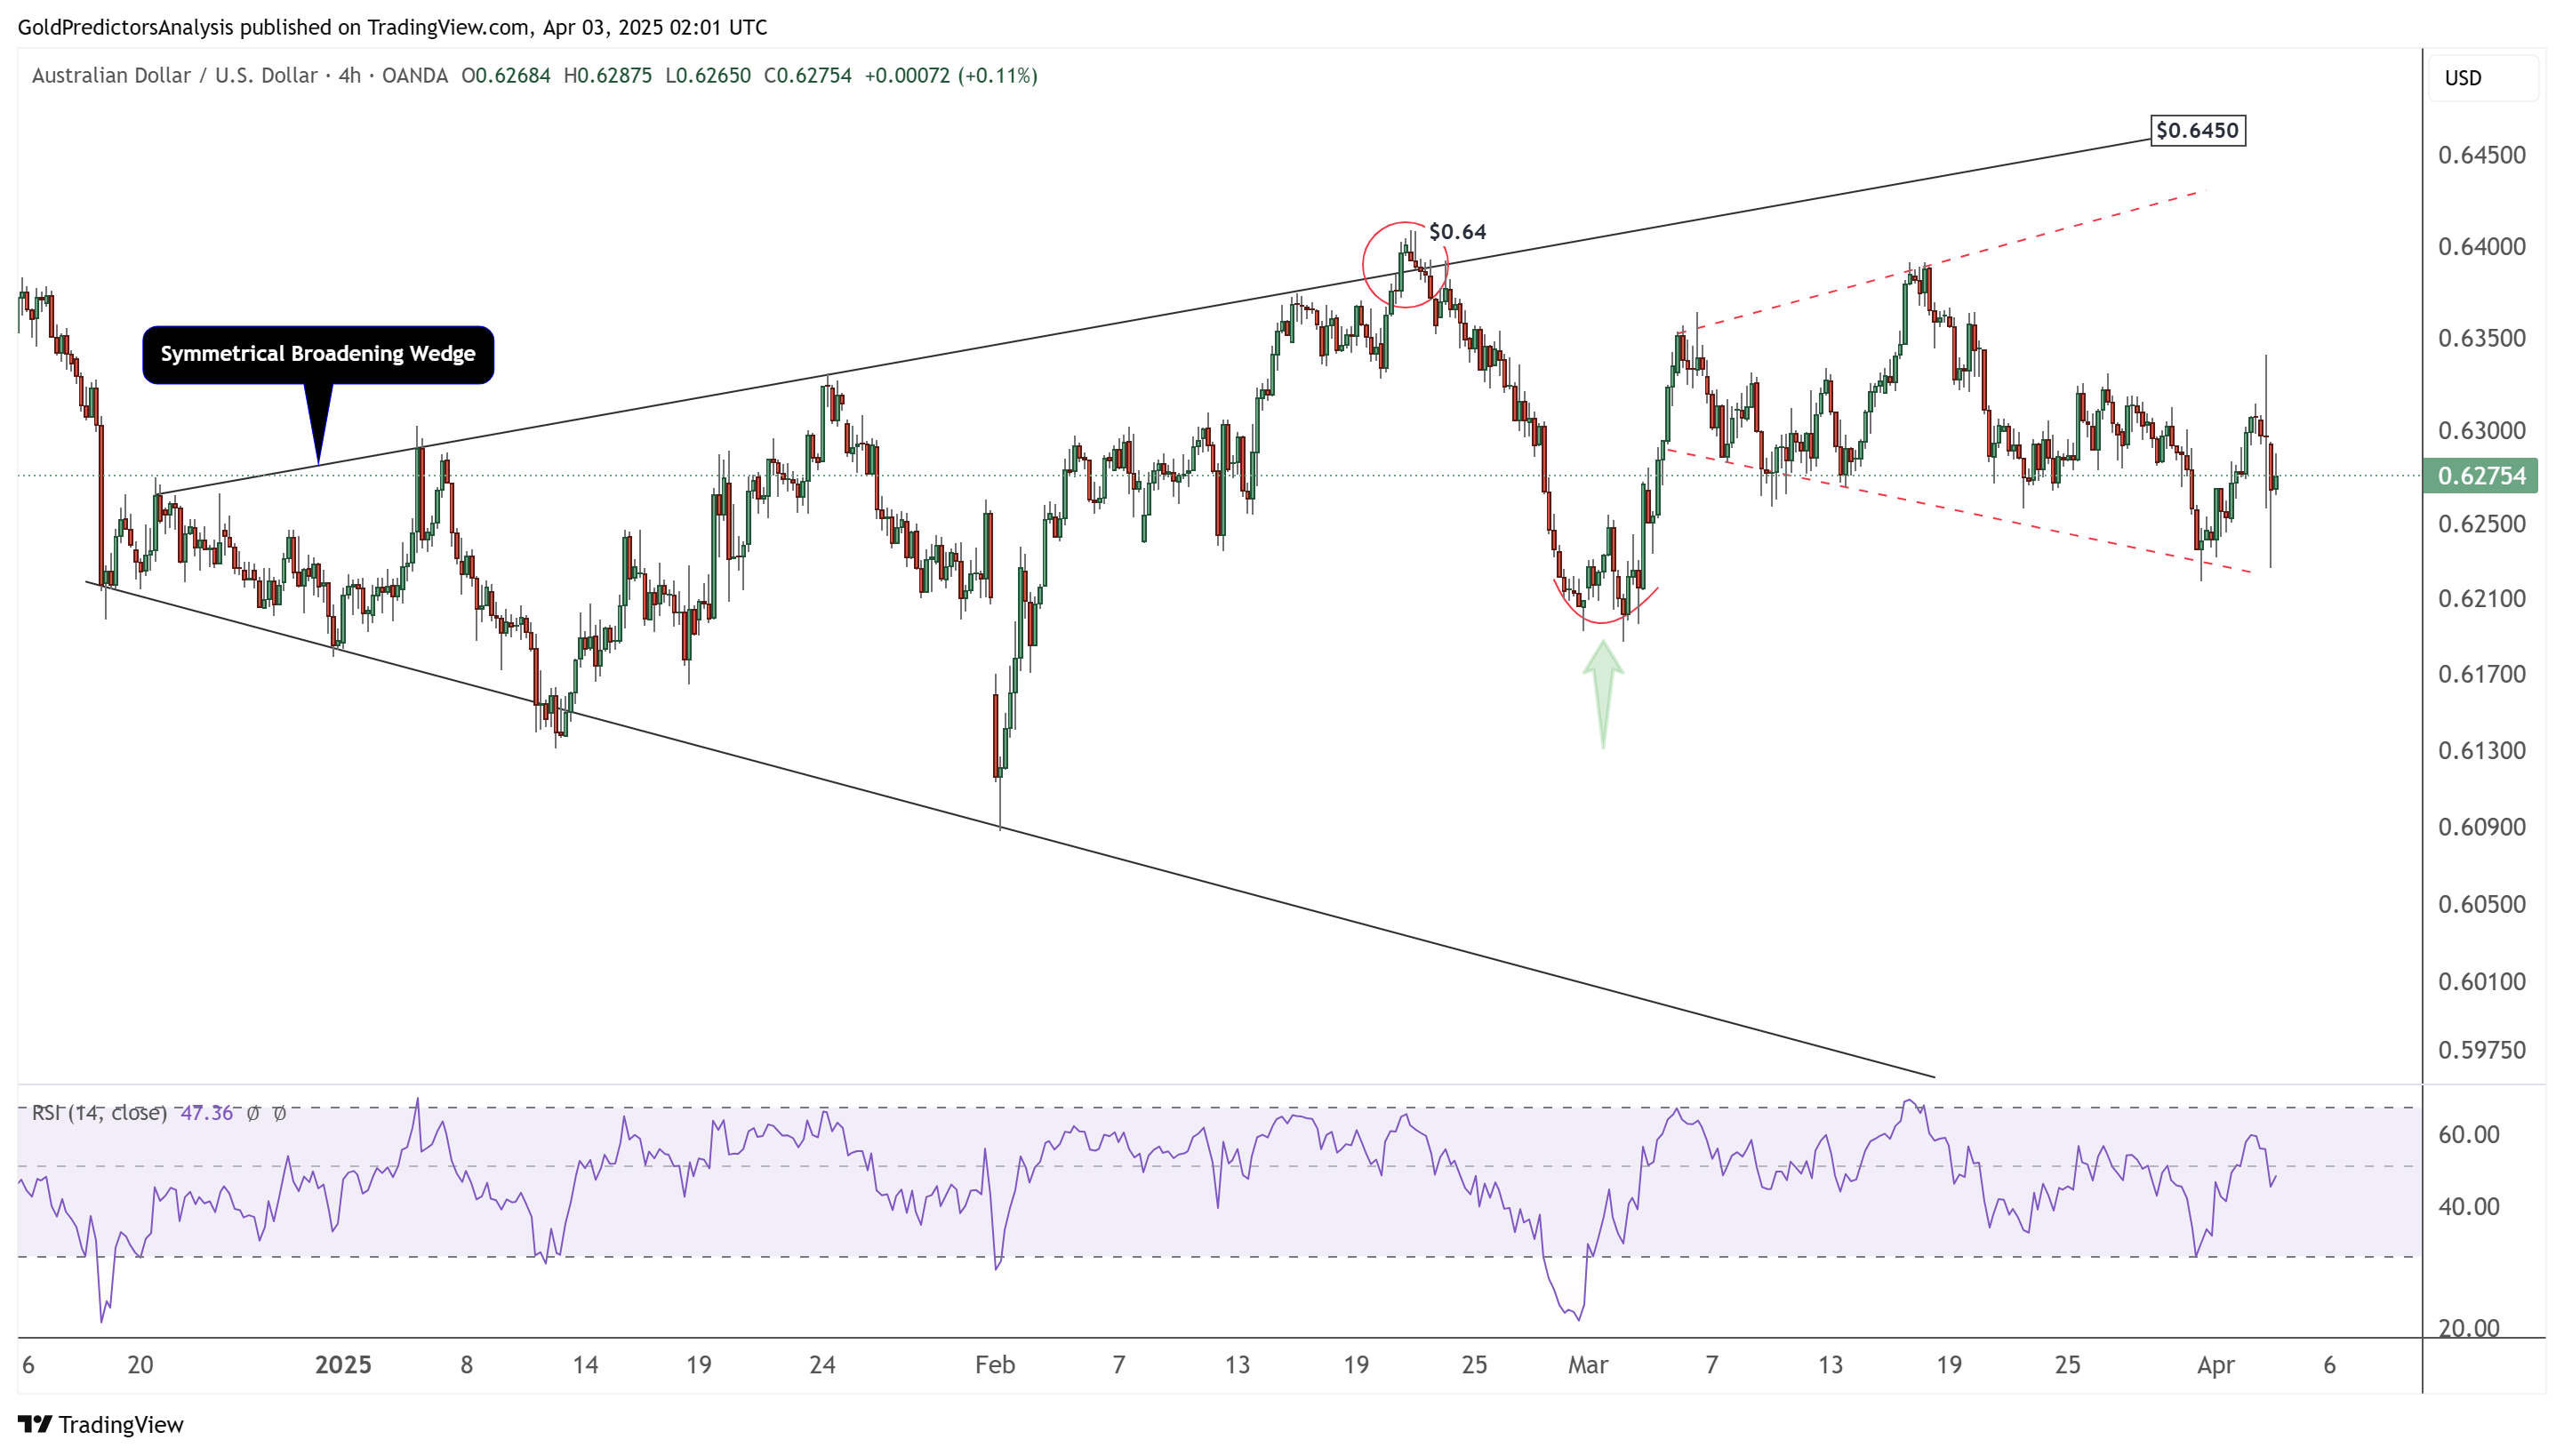
AUD/USD Technical Analysis – Volatility
The 4-hour chart for AUD/USD shows strong volatility within the formation of an ascending broadening wedge pattern. The price has been fluctuating between $0.62 and $0.64. A breakout from these levels will determine the next direction for AUD/USD. Volatility increased after President Trump’s speech, as the US Dollar continues to decline under bearish pressure.