Русский


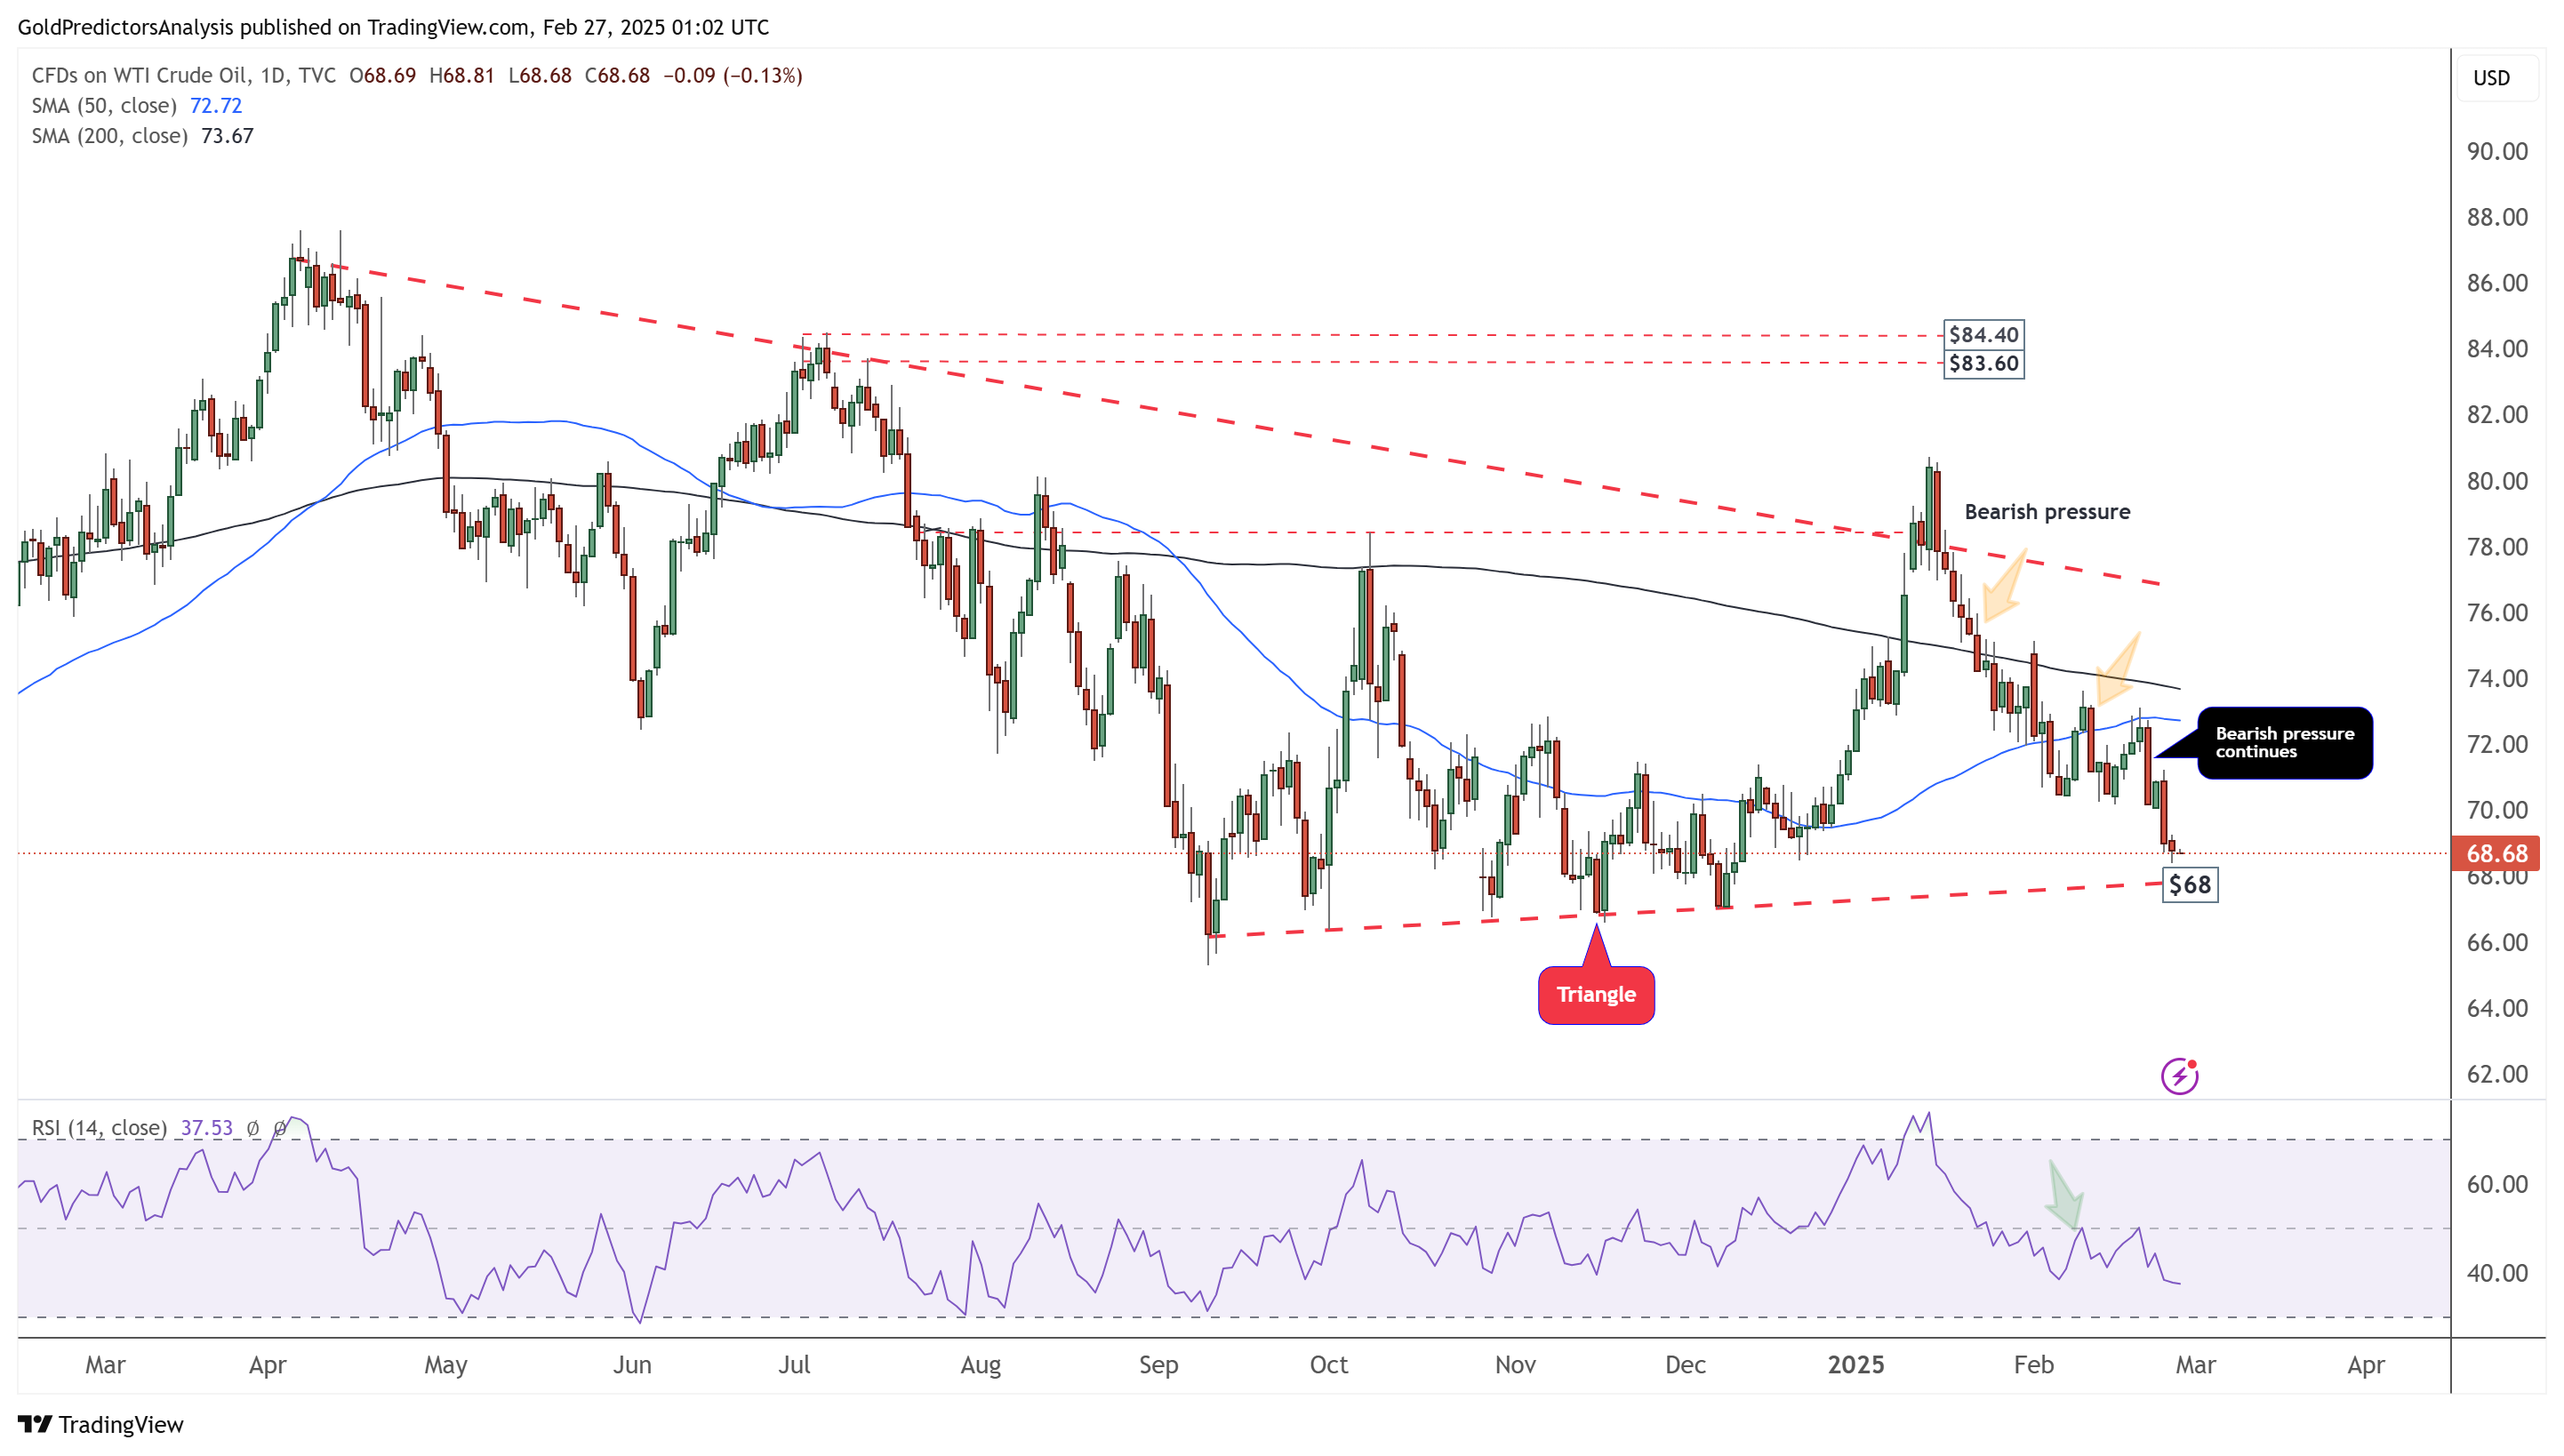
 Oil Daily Chart – Bearish Pressure
The daily chart for WTI crude oil shows that the price is approaching the target of $66–$68 and is seeking its next direction. This target is derived from the triangle pattern that developed in 2024. Since price uncertainty persists, a rebound from this target zone is likely.
Overall, the oil market remains under bearish pressure, and a break below $66 could trigger a long-term downtrend. The RSI is still above the oversold level, indicating the potential for further downside momentum.
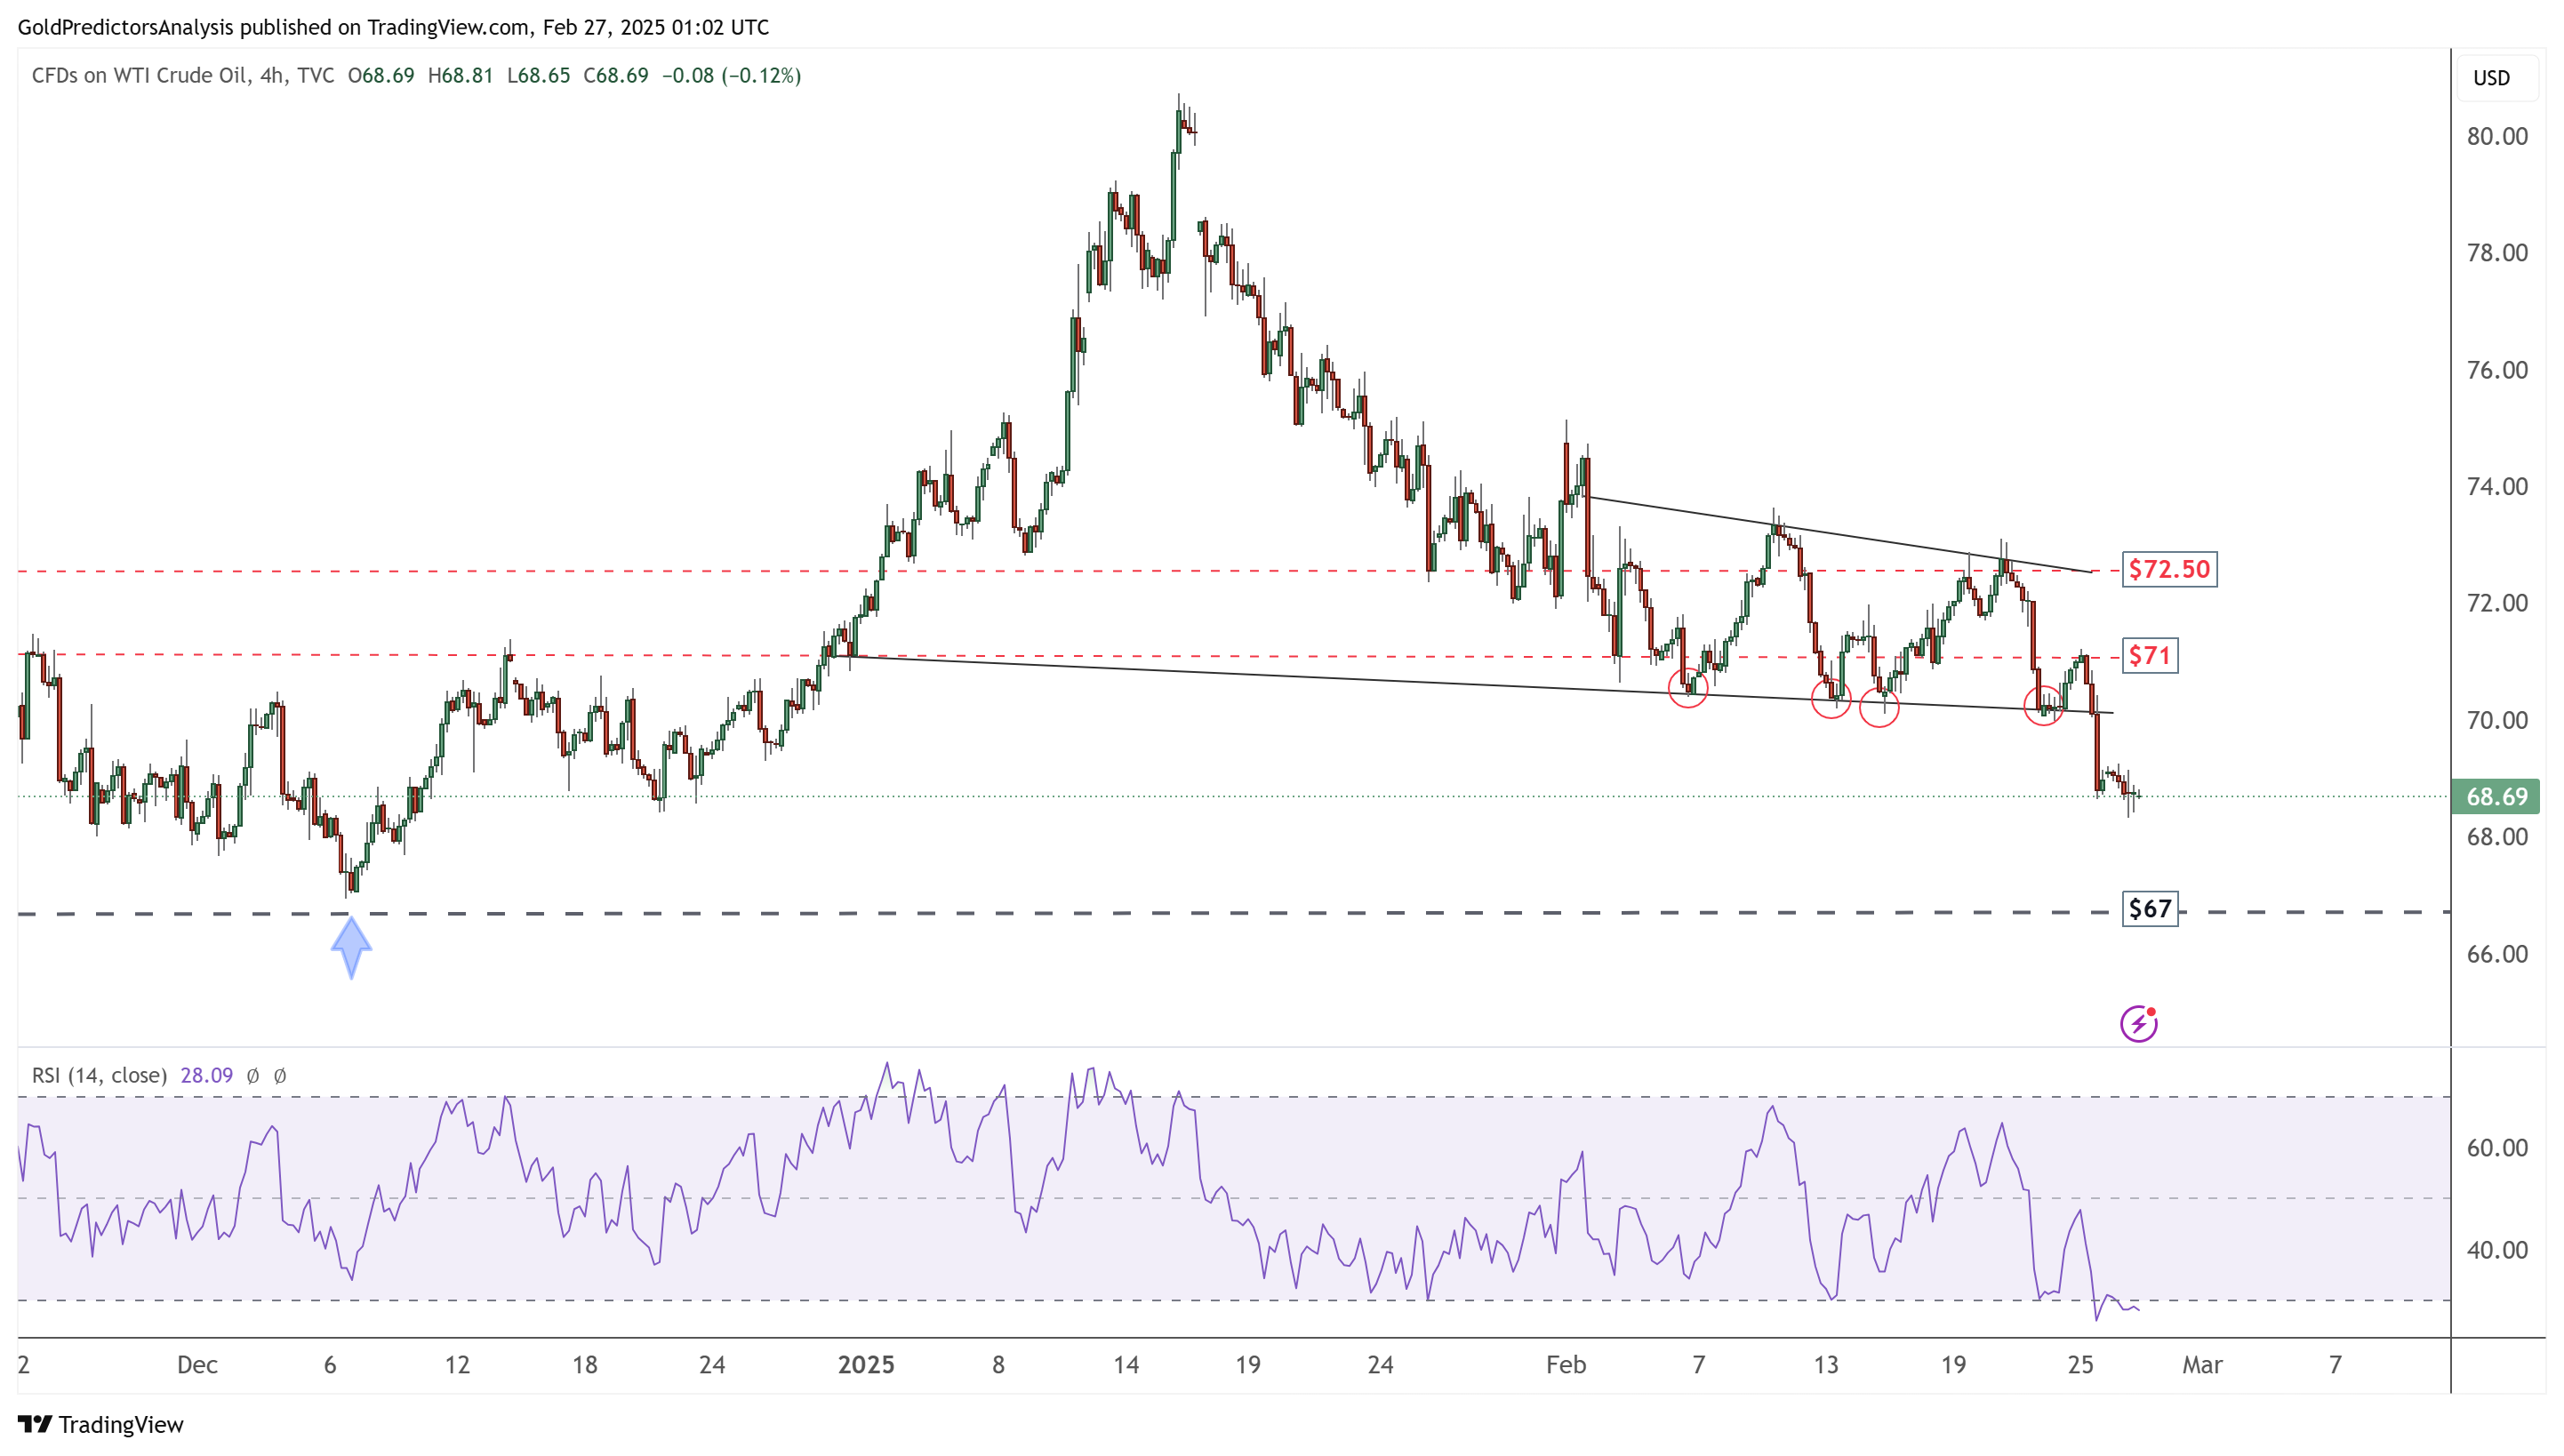
Oil 4-Hour Chart – Bearish Pressure
The 4-hour chart for WTI oil shows that the price remains under bearish pressure below the $72.50 level. The price has broken the black trendline and continues to accelerate downward. The immediate support lies around $67–$68.