Русский


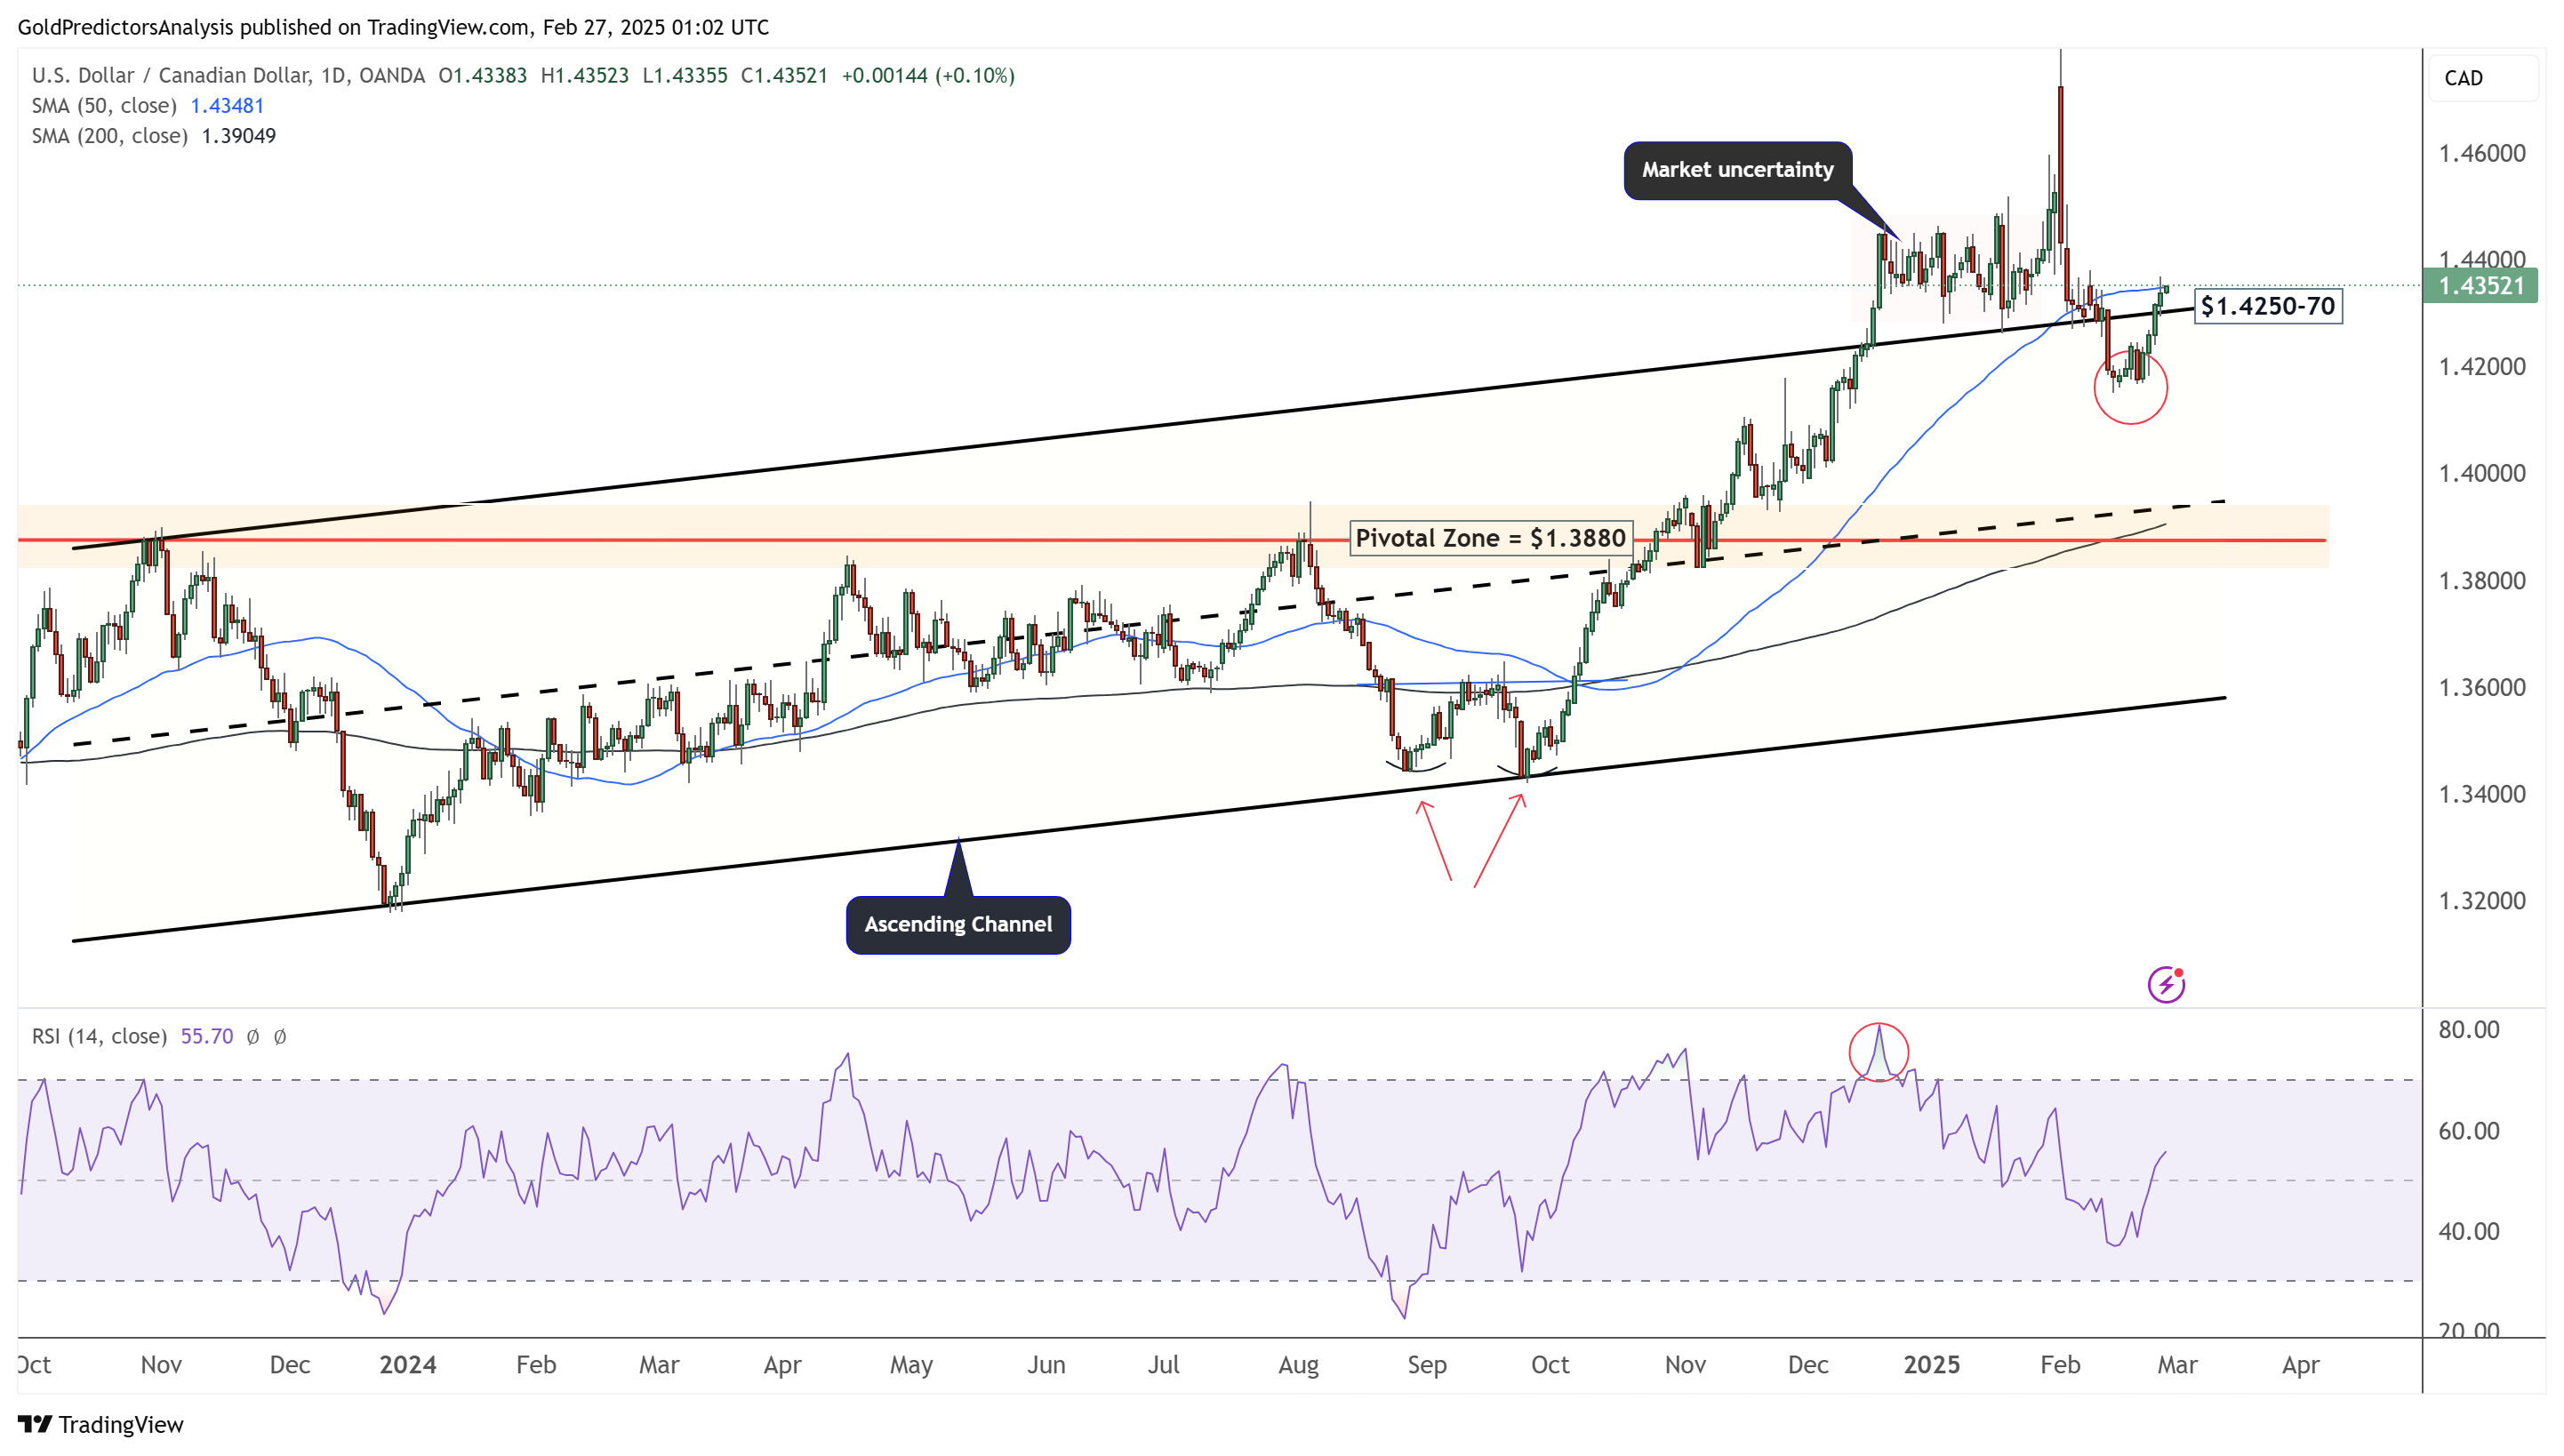
 USD/CAD Daily – Price Rebound
The daily chart for USD/CAD shows that the pair has rebounded from $1.4170 and is testing the 50-day SMA as strong daily resistance. A daily close above $1.4350 will confirm the bullish trend and increase the pair. However, a break below $1.4170 could signal further correction before the next move higher. The overall trend remains upward, with the pair consistently moving higher.
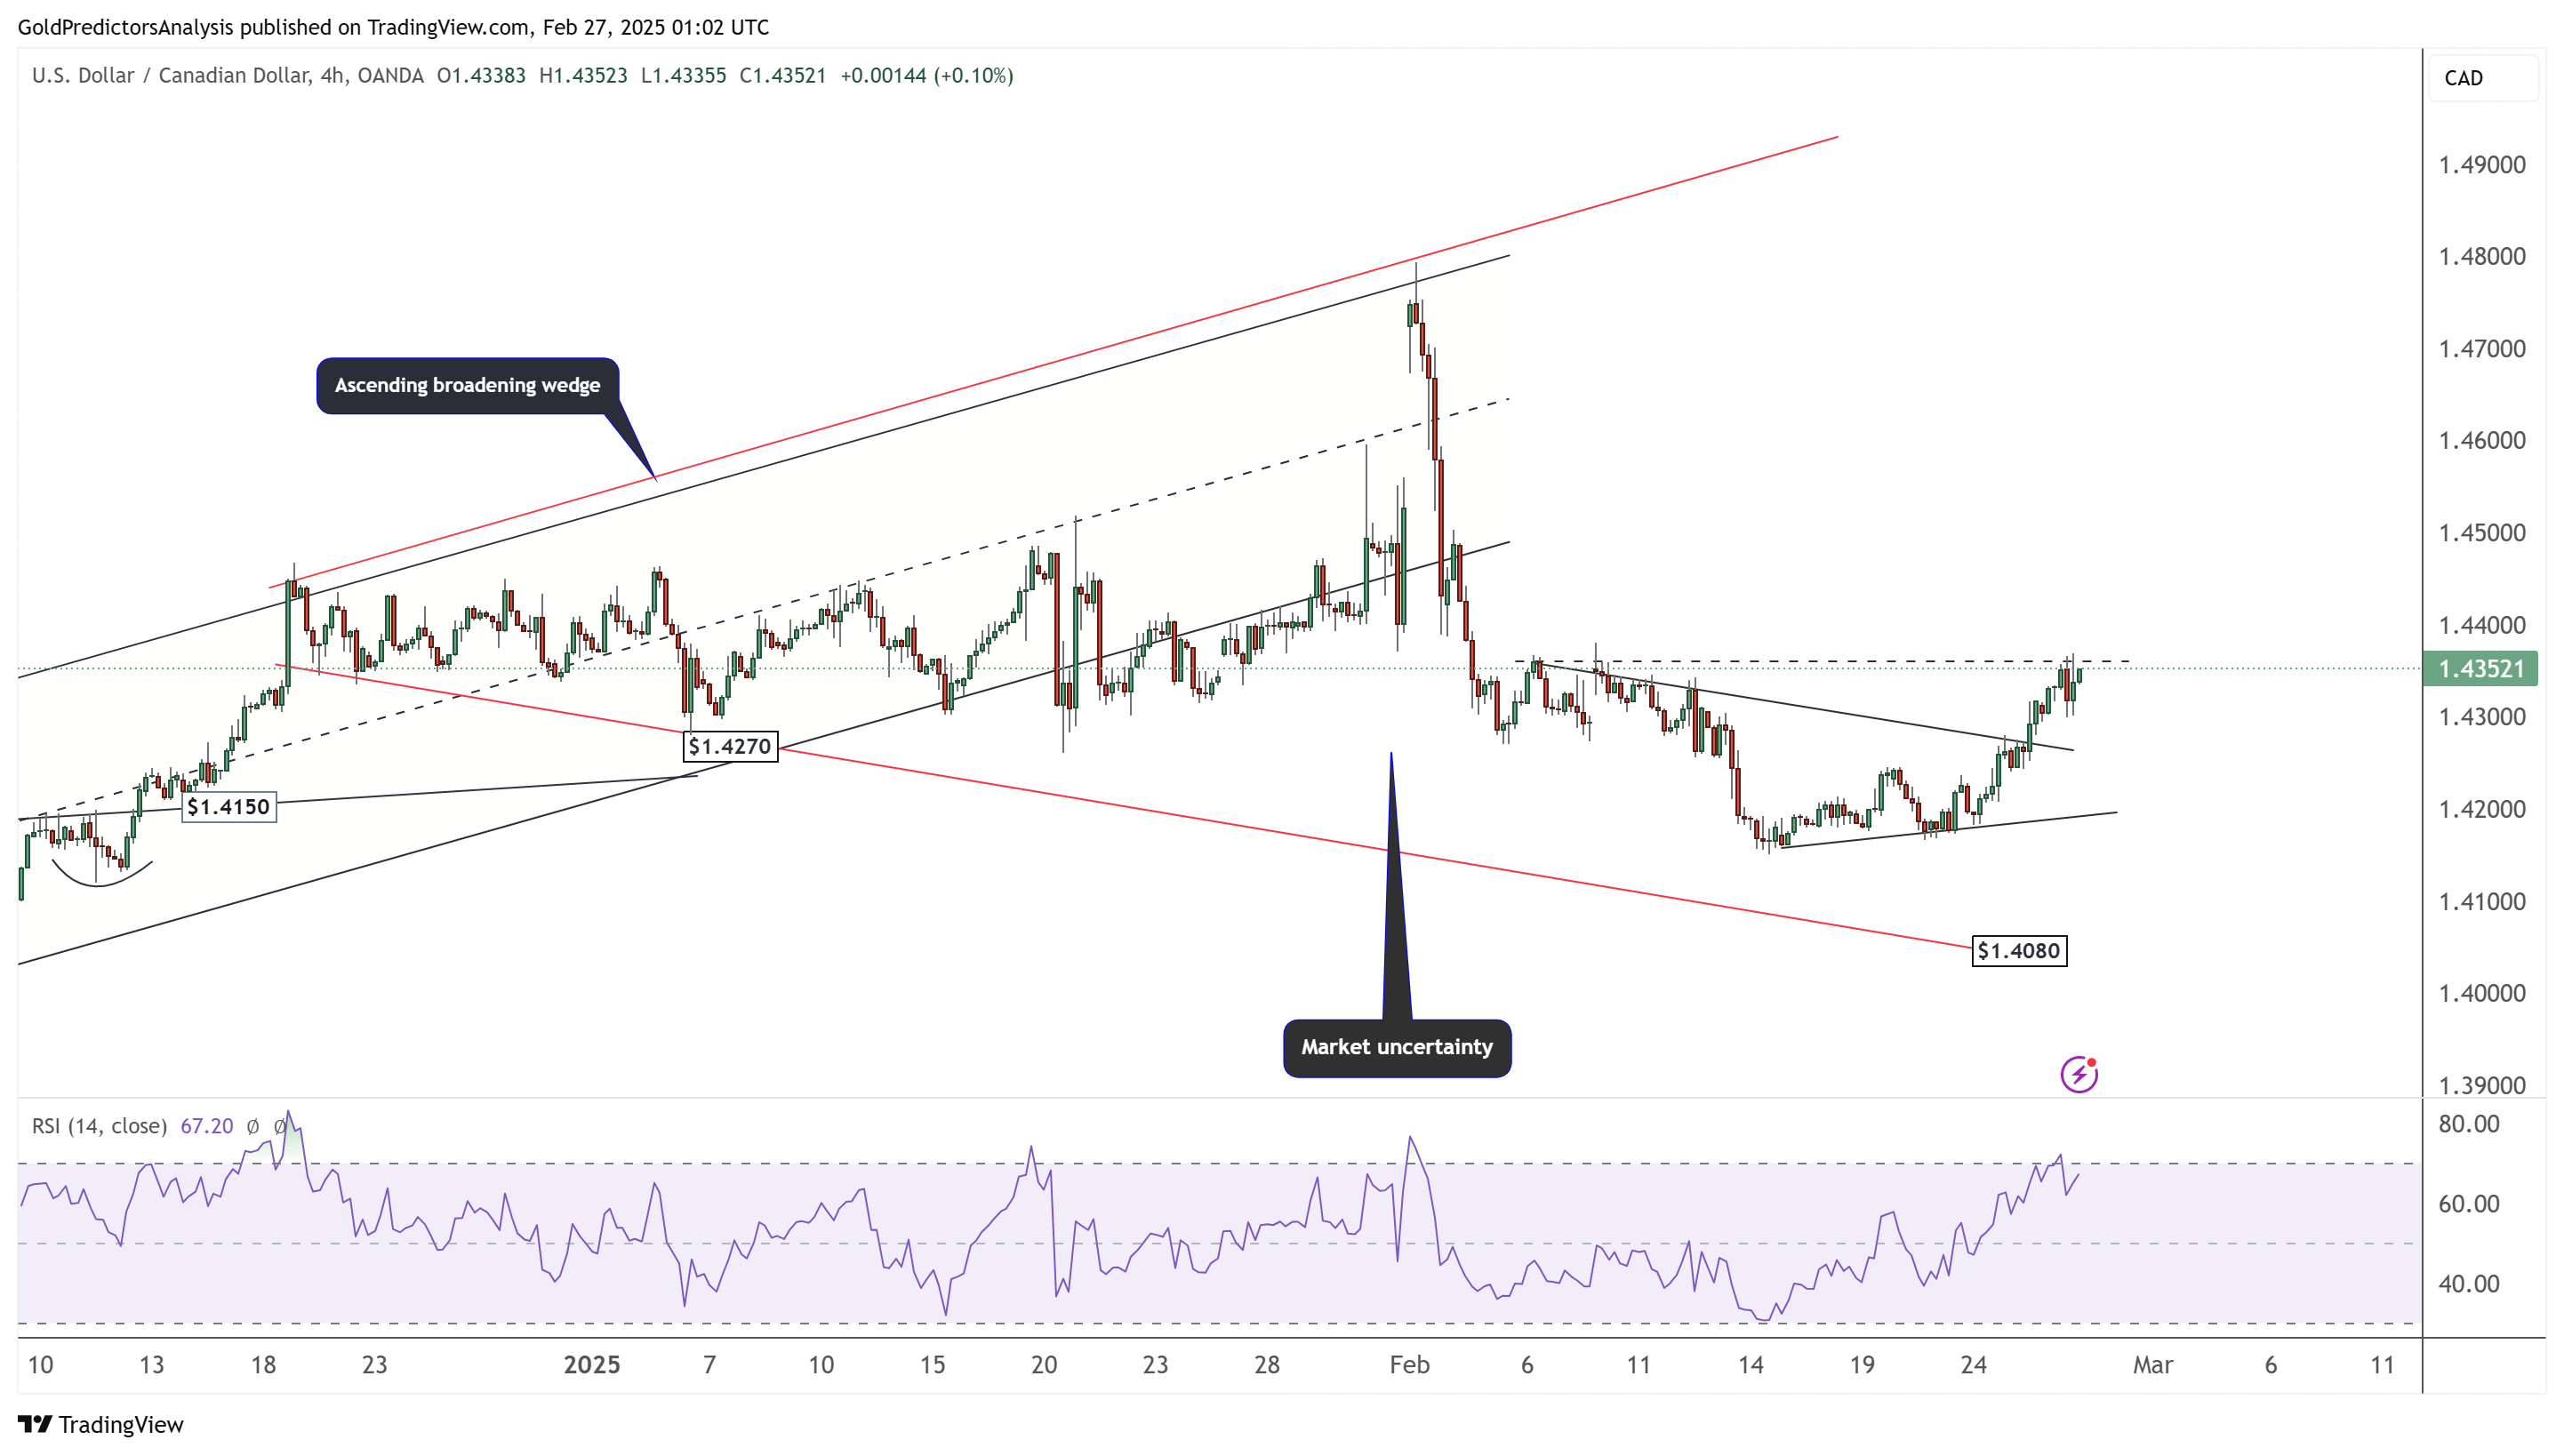
USD/CAD 4-Hour Chart – Symmetrical Broadening Wedge
The 4-hour chart for USD/CAD shows strong volatility as the pair forms a symmetrical broadening wedge pattern after breaking out of the ascending channel. The rebound from the key support level has reached daily resistance, where price uncertainty persists due to high volatility in the energy market and ongoing global trade tensions.