Русский


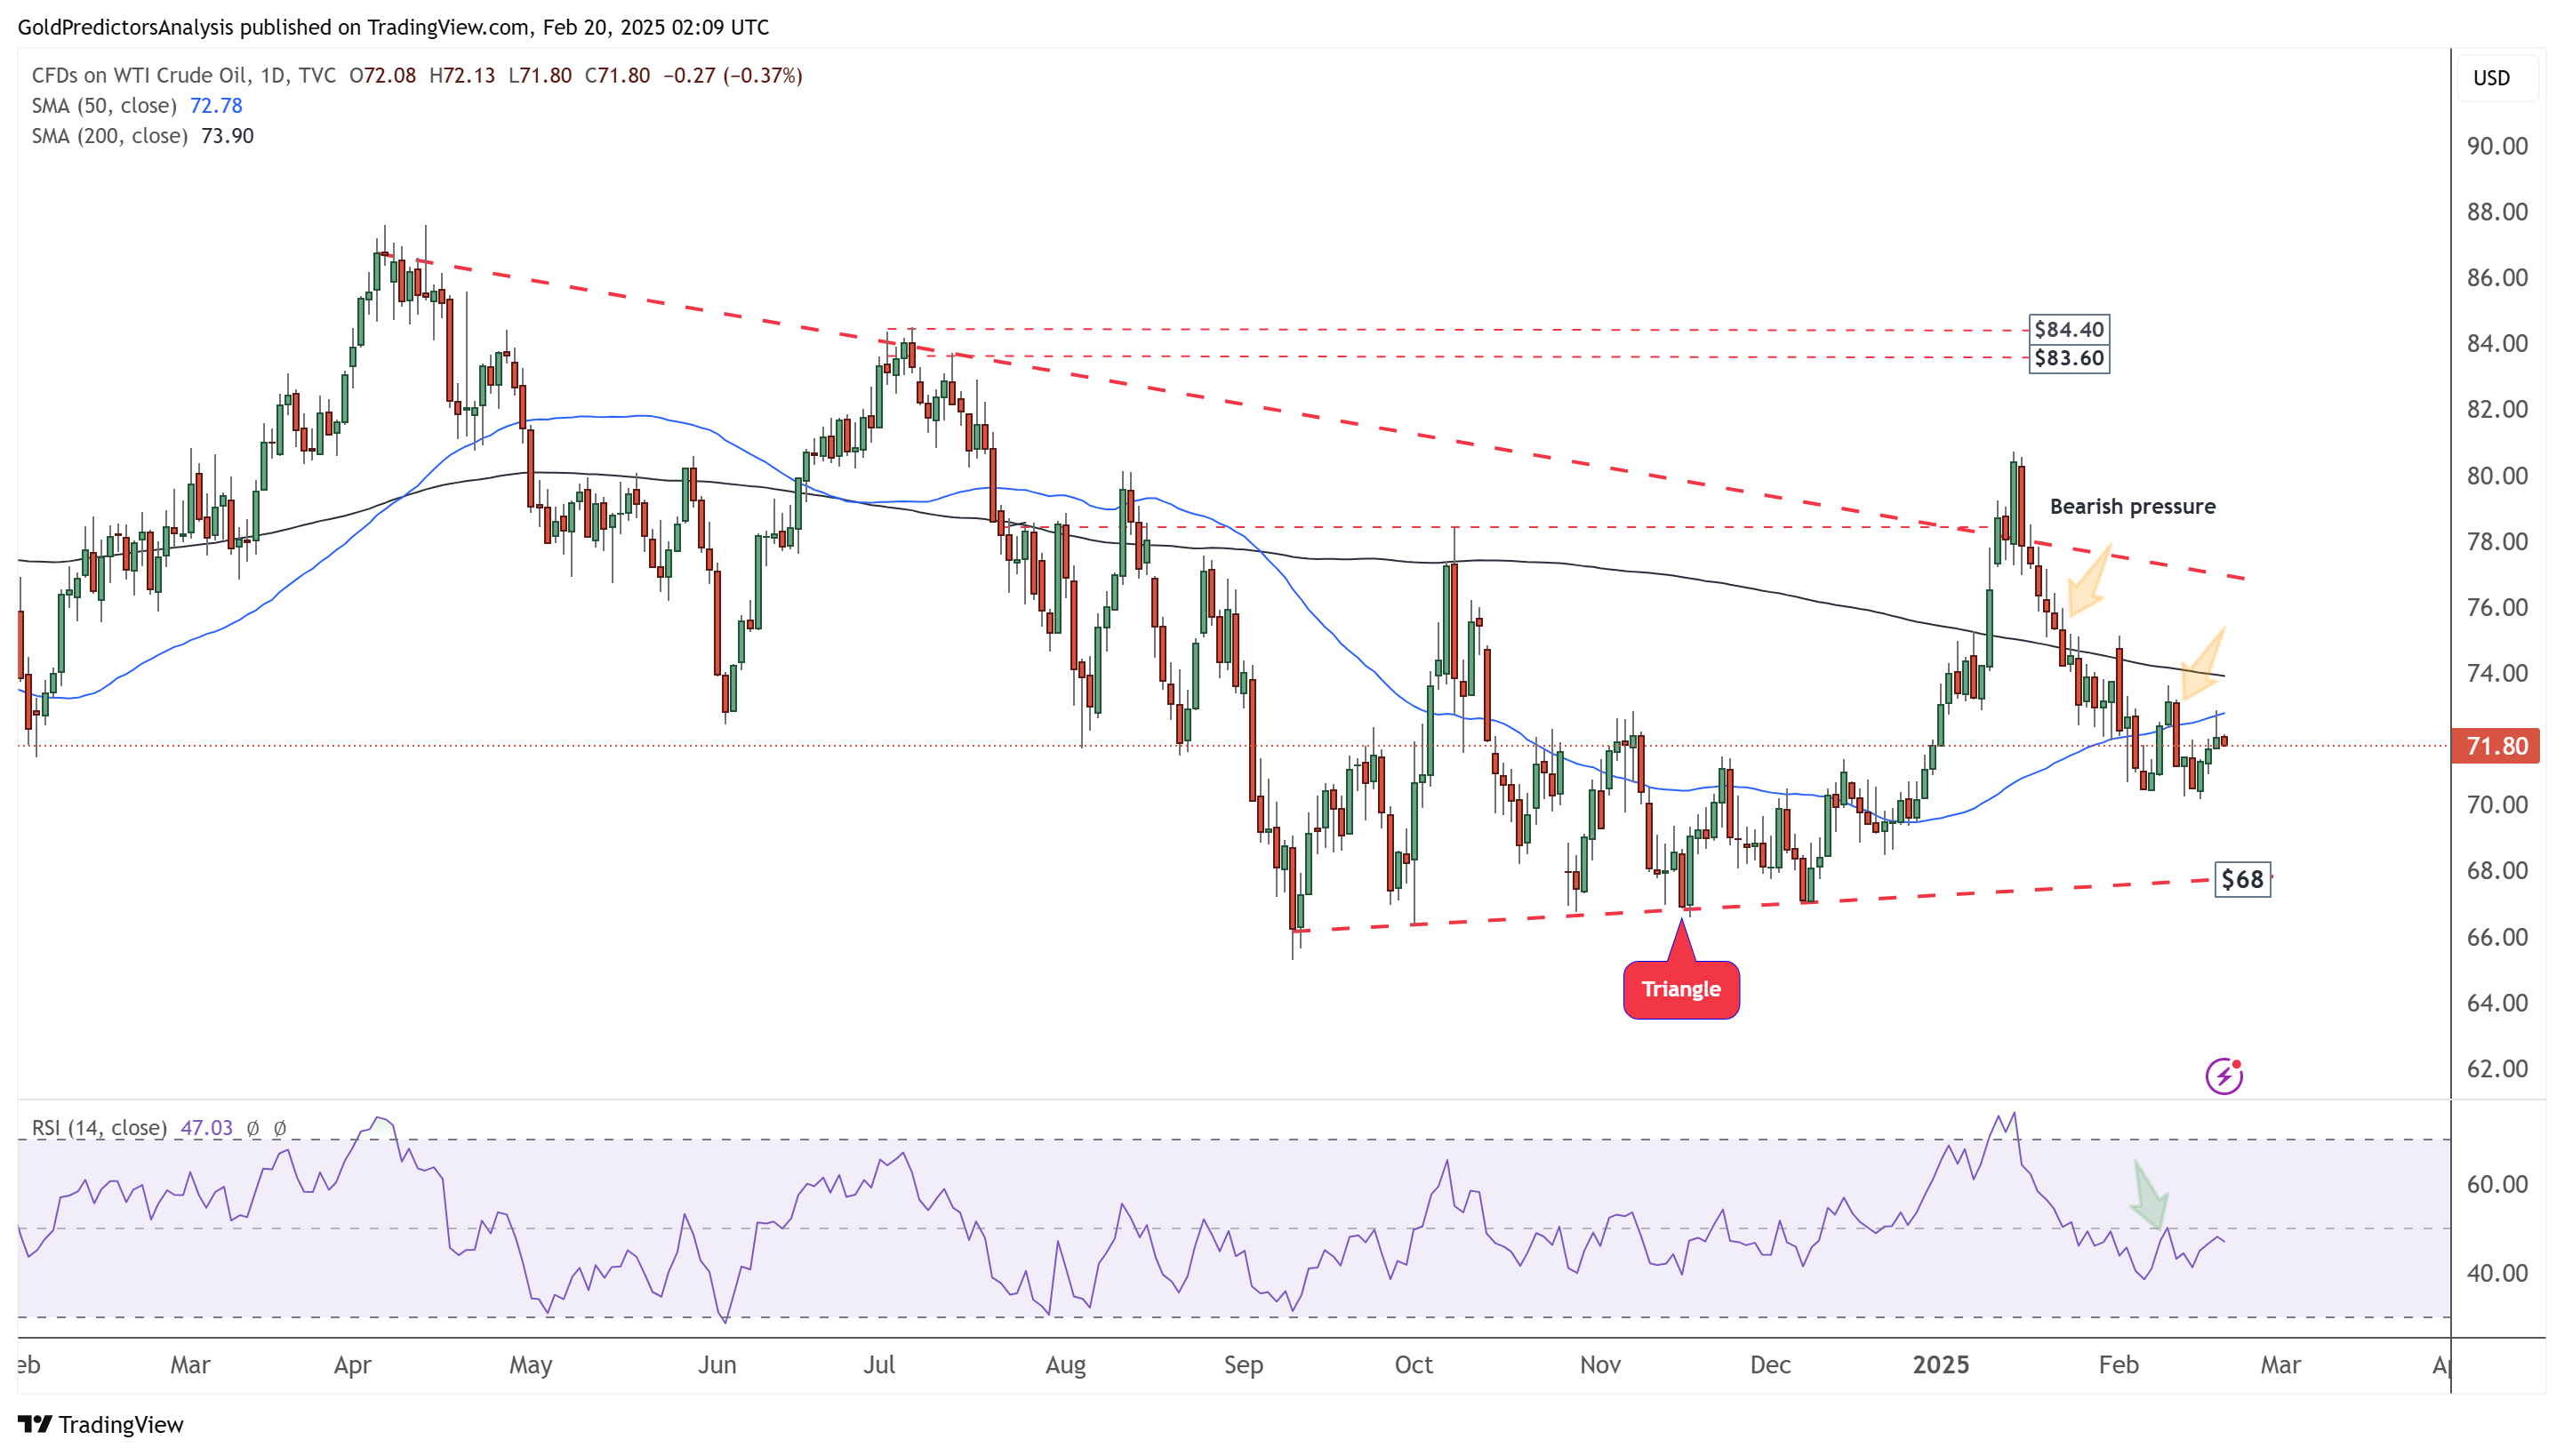
 Oil Daily Chart – Bearish Pressure
The daily chart for WTI crude oil shows that the price has hit $72.50 and continues to decline, further reinforcing bearish pressure. Moreover, the 50-day and 200-day SMAs are trending downward, with the price trading below them, which clearly indicates a negative trend. Additionally, the RSI remains below the mid-level, further signaling the continuation of the downtrend.
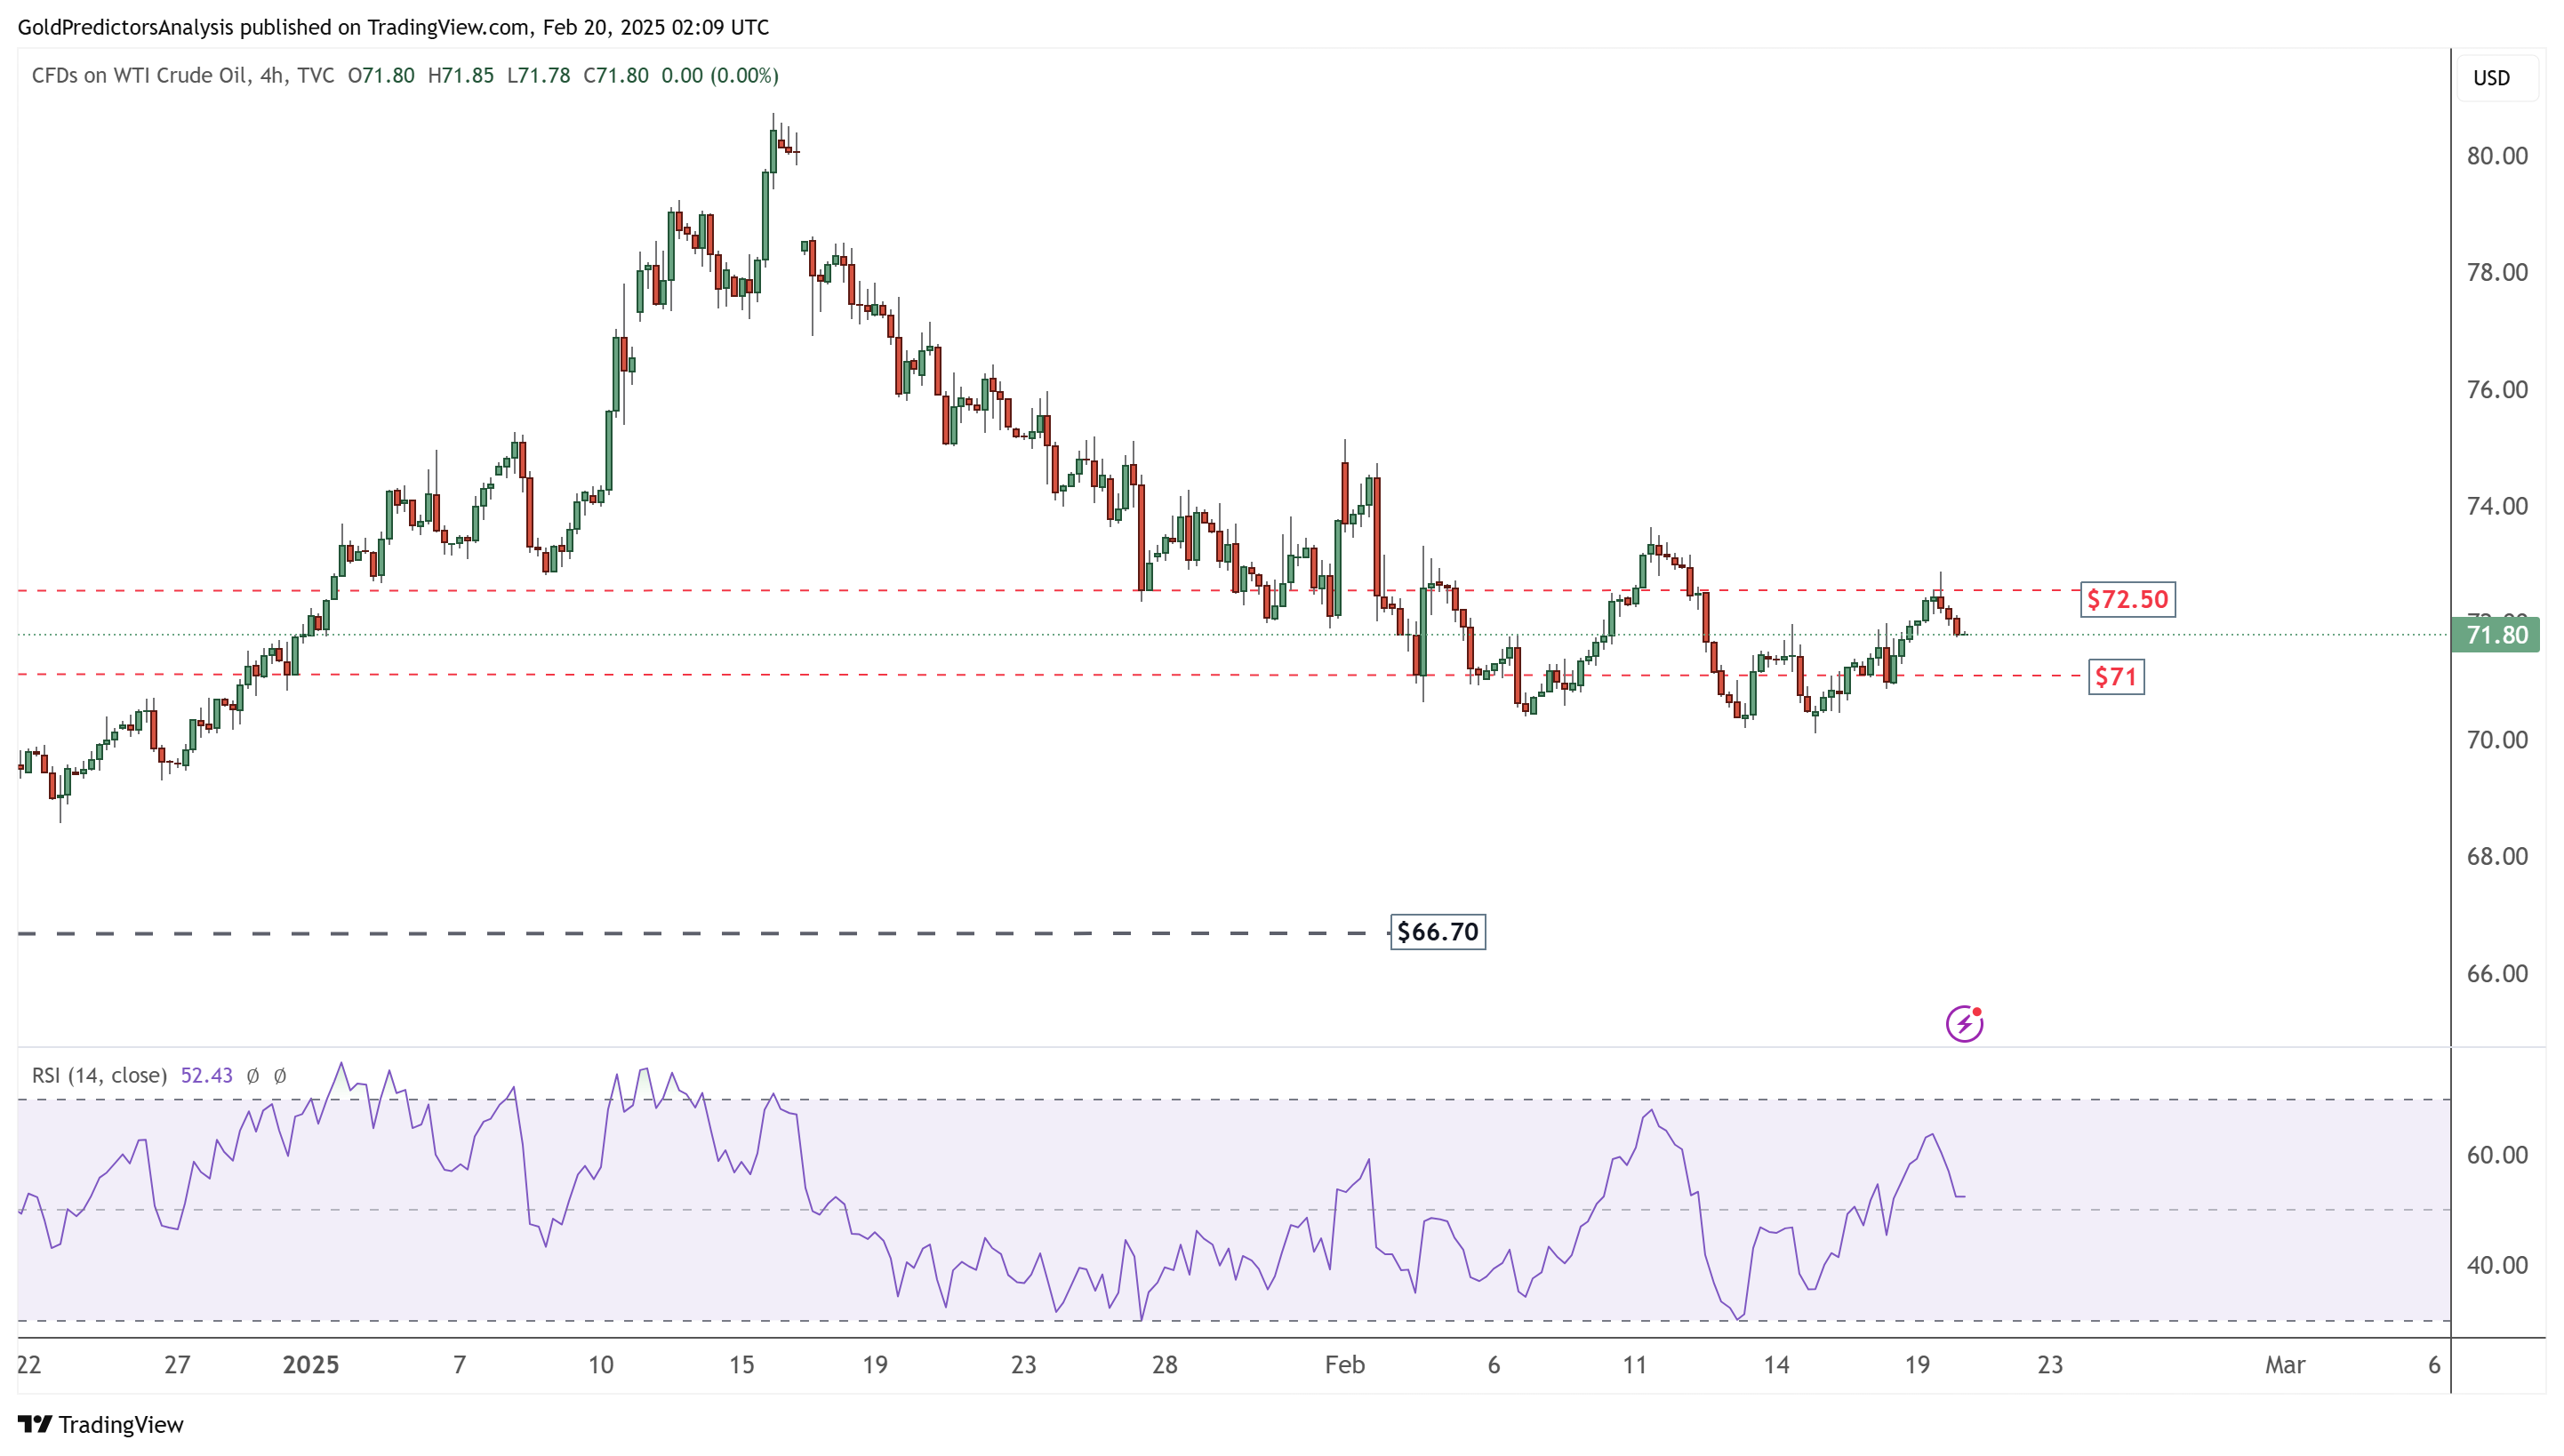
Oil 4-Hour Chart – Bearish Pressure
The 4-hour chart shows a bearish trend in WTI crude oil, with the price hitting resistance at $72.50 and declining. Meanwhile, support lies at $71, and the likelihood of a continued downward trend remains high. Furthermore, a break below $70 could trigger a stronger bearish move in the WTI crude oil market.