Русский


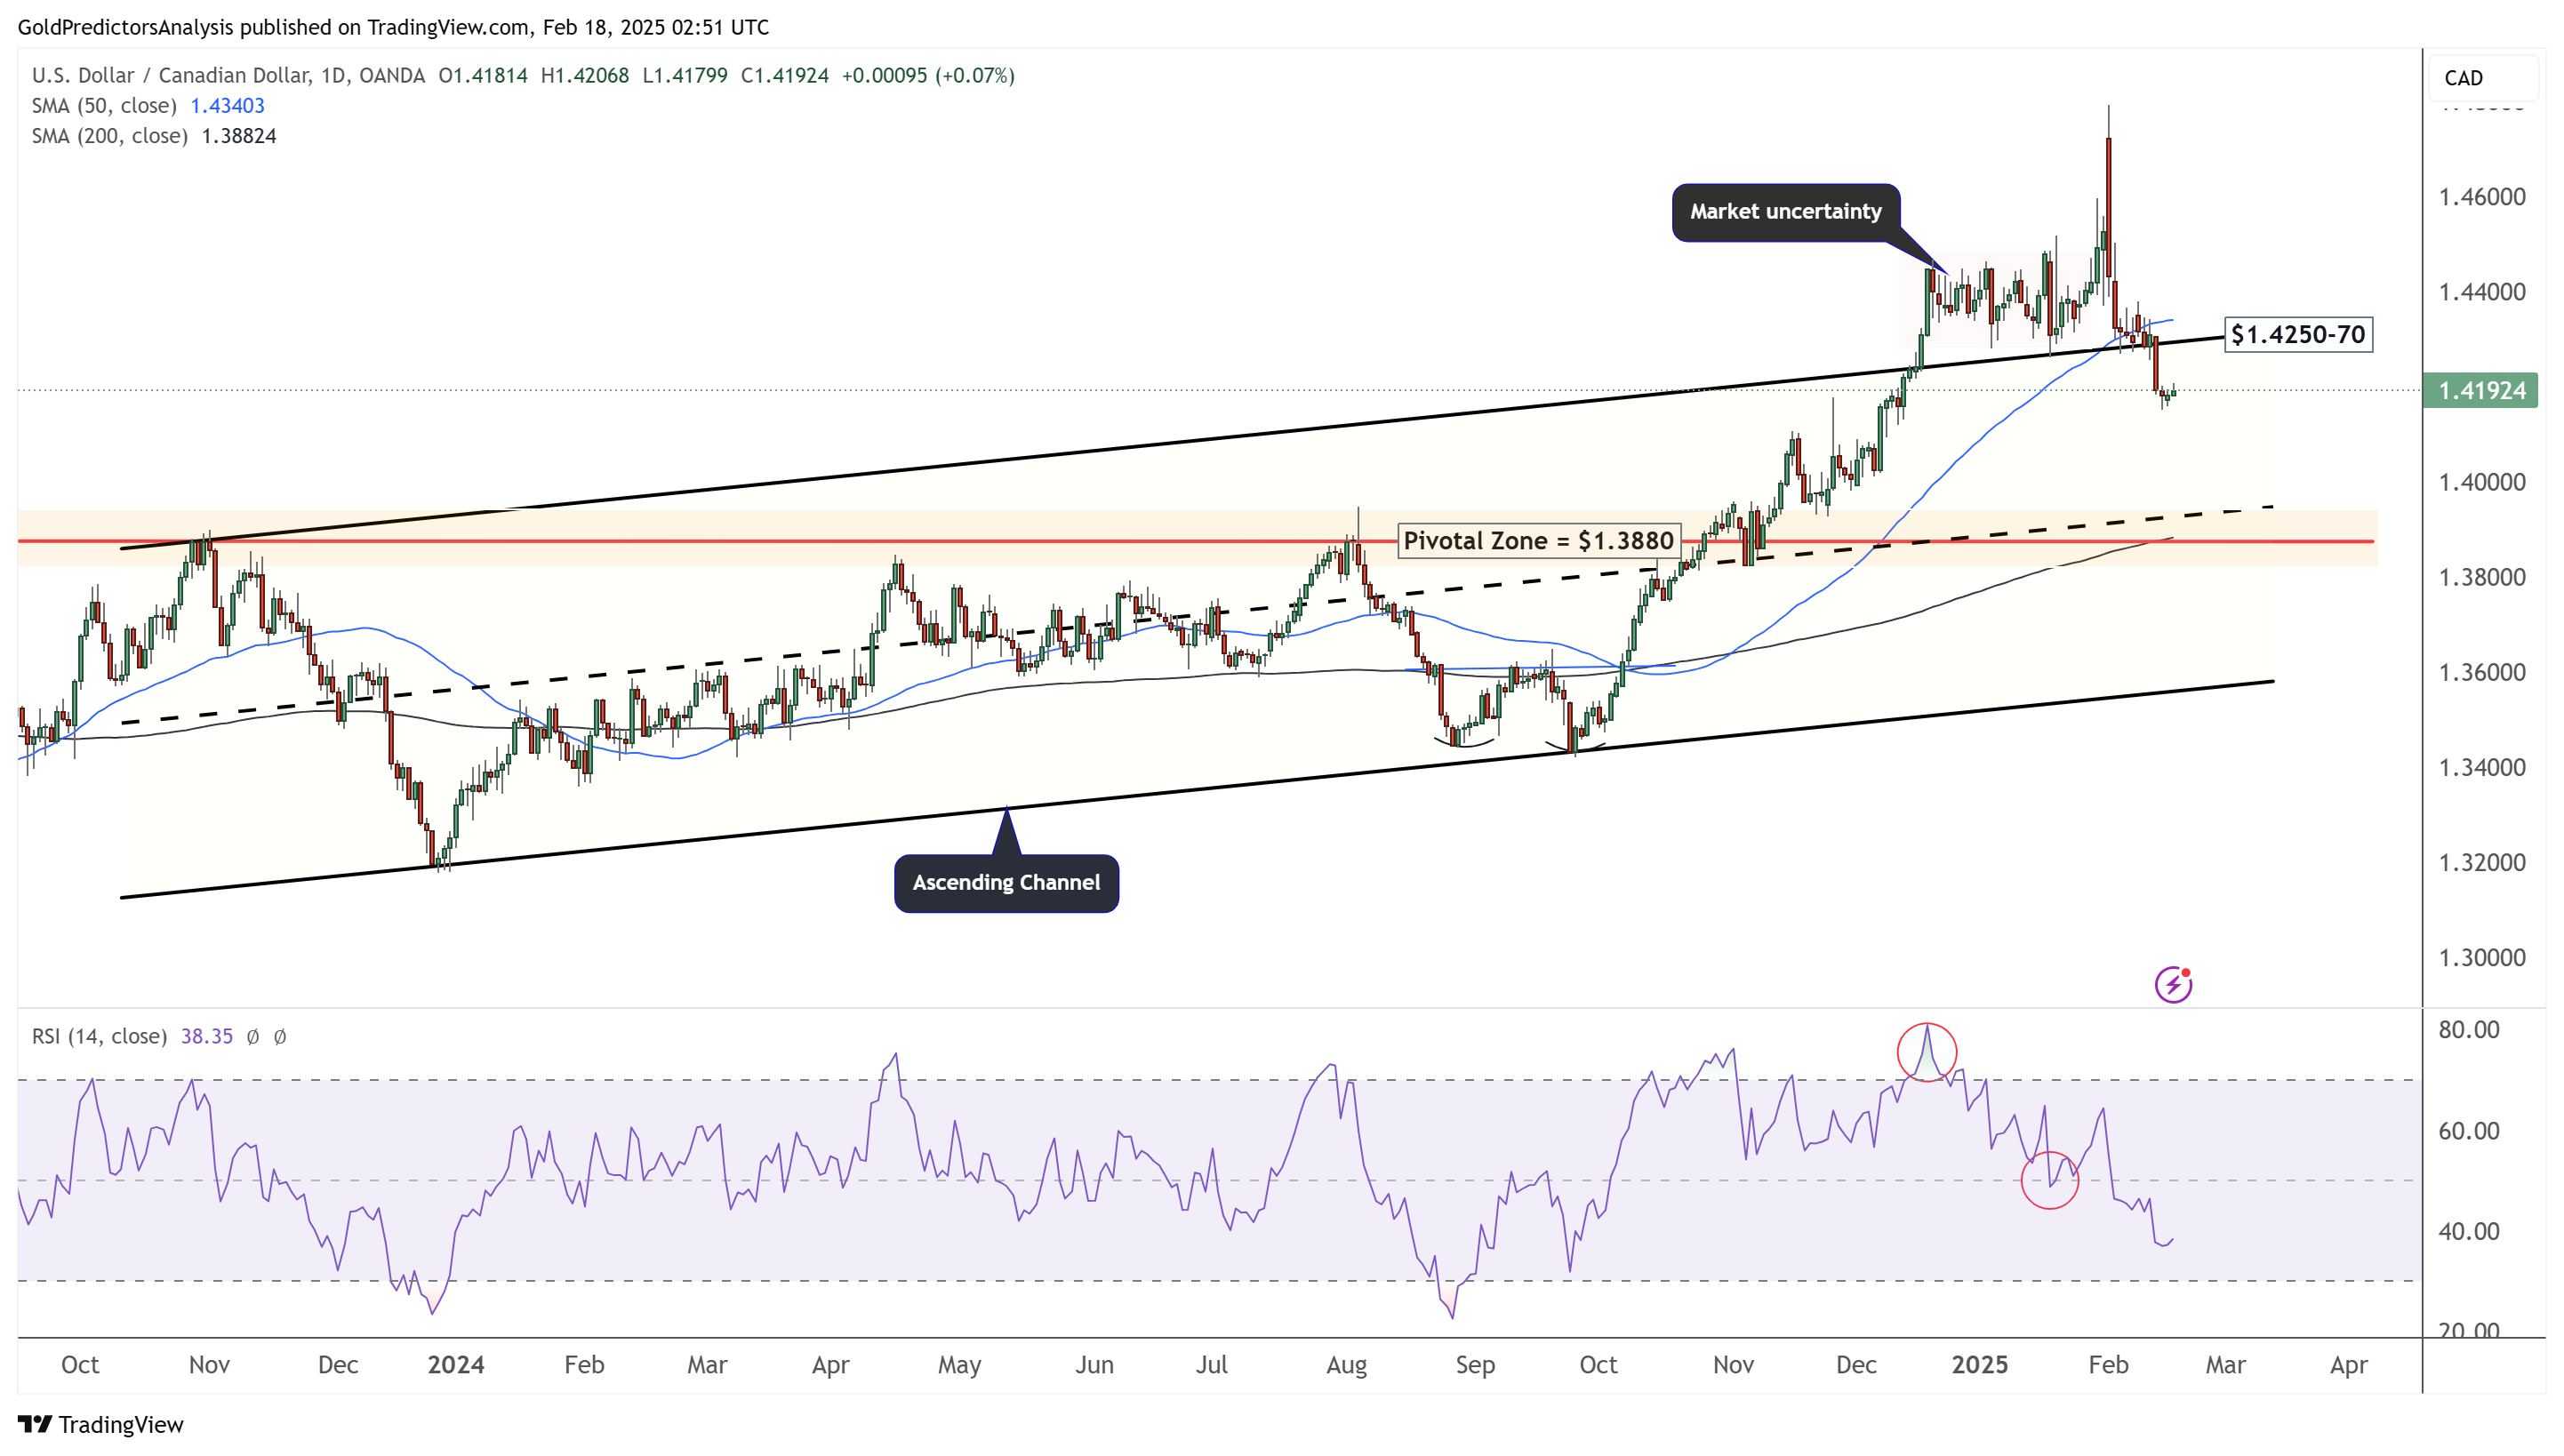
 USD/CAD Daily – Market Uncertainty
The daily chart for USD/CAD shows that the pair has started a strong correction, breaking below the ascending channel after peaking at the $1.48 zone. The sharp drop from $1.48 suggests a further price correction towards the $1.3880 pivotal zone, where the 200-day SMA is located. The weakness in the US Dollar Index has contributed to this decline.
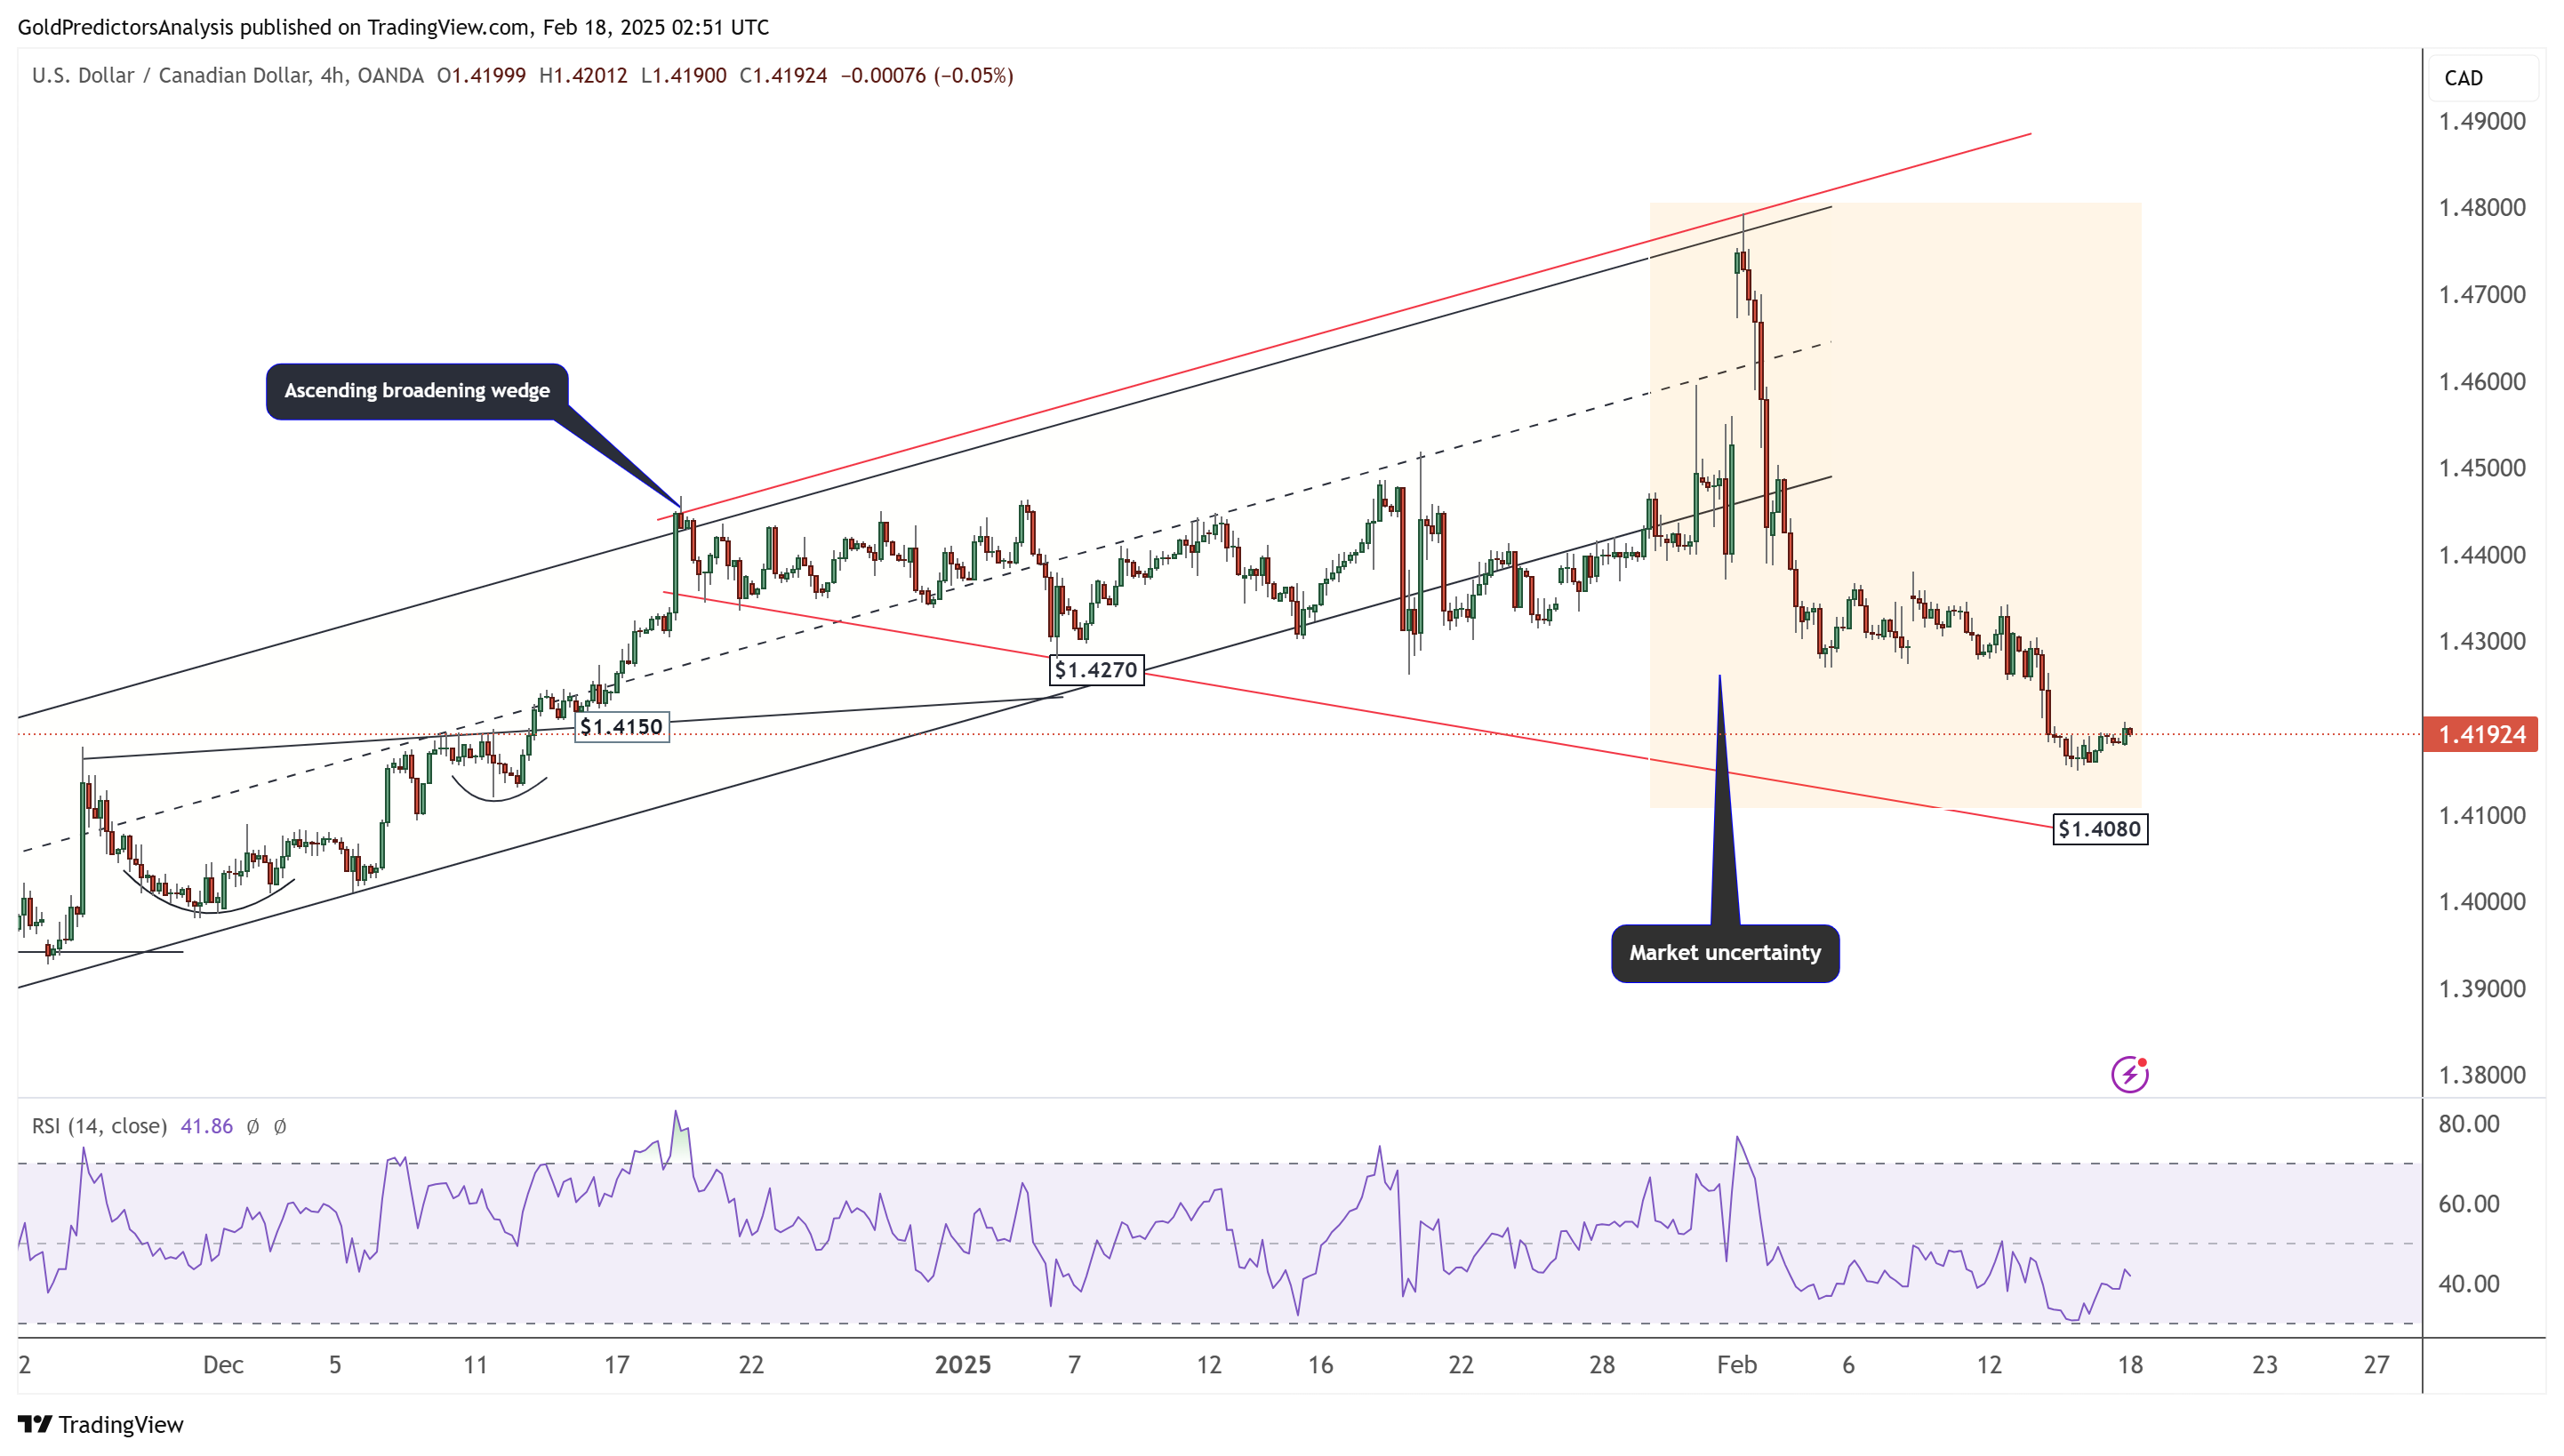
USD/CAD 4-Hour Chart – Symmetrical Broadening Wedge
The 4-hour chart for USD/CAD shows that the pair remains within the ascending broadening wedge, indicating strong price volatility. Currently, the price is dropping towards the $1.4080 support level, which aligns with the support of the ascending broadening wedge pattern. Meanwhile, the RSI has hit oversold levels, suggesting a potential short-term rebound from these levels. Therefore, traders may anticipate a temporary price recovery before the next directional move unfolds.