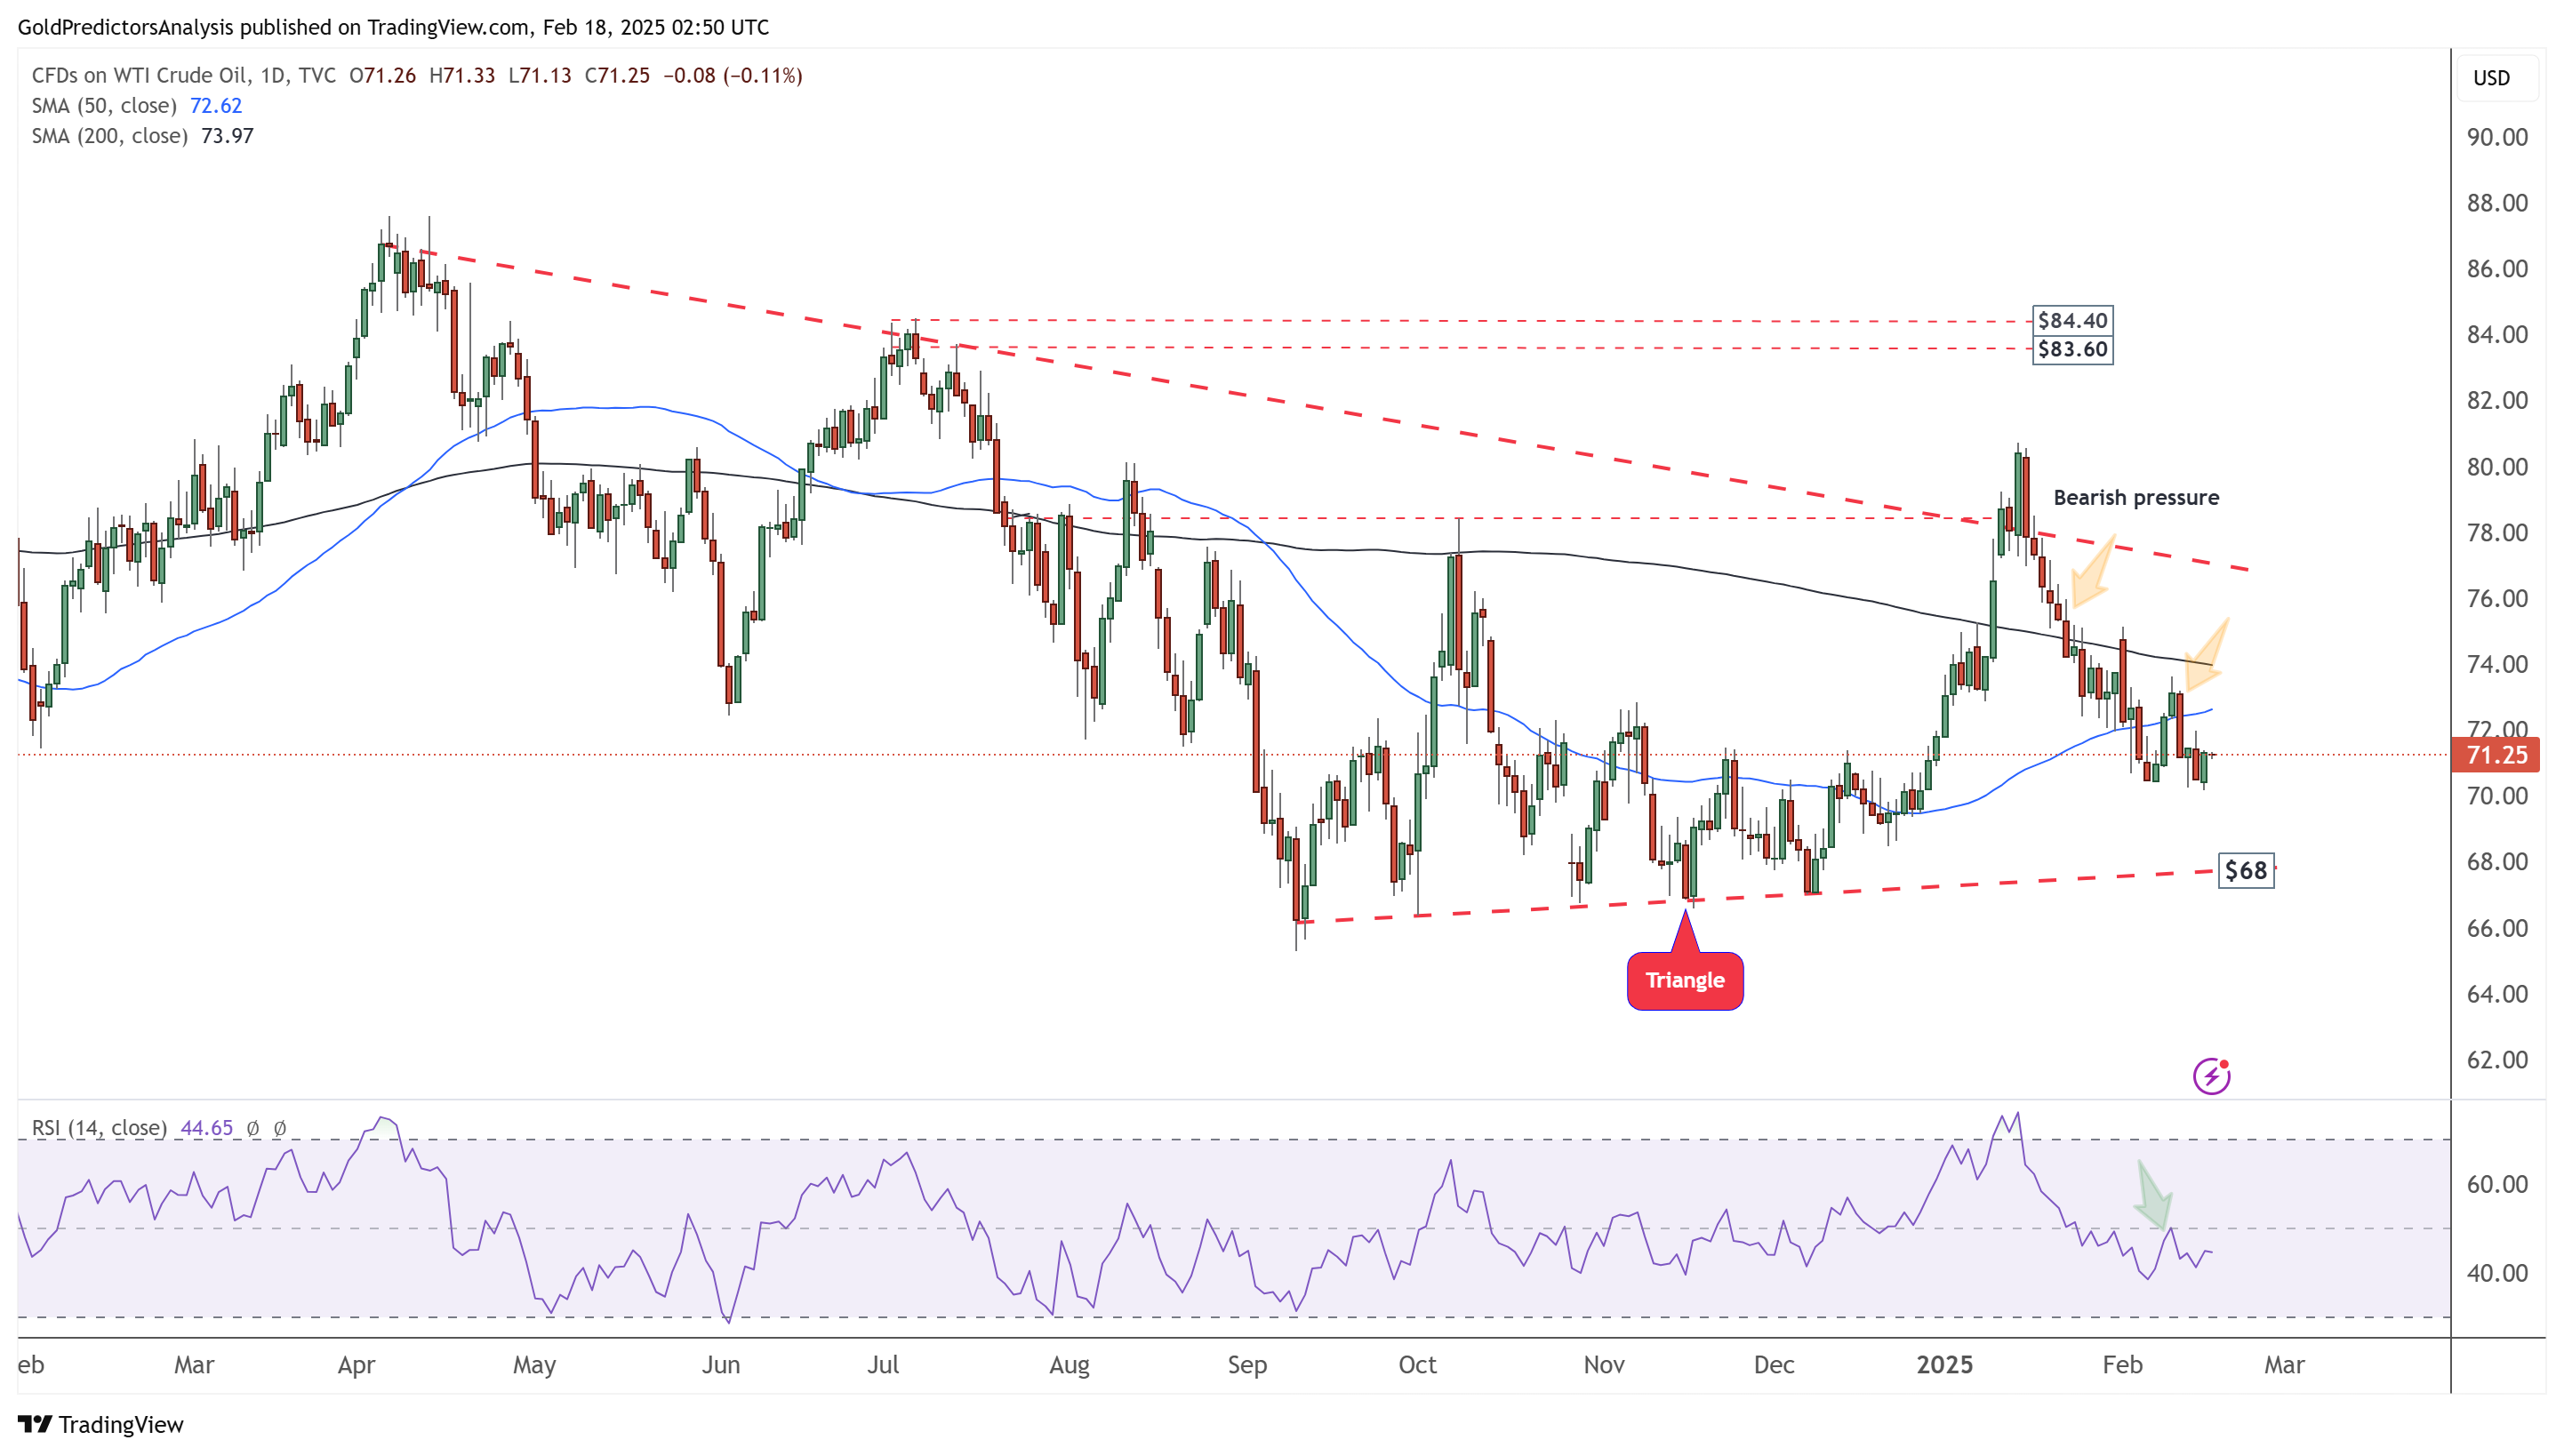
 Oil Daily Chart – Bearish Pressure
The daily chart for WTI crude oil shows that the price currently remains within the triangle formation and is under bearish pressure. Furthermore, prices will likely accelerate downward as the price stays below the 50-day and 200-day SMAs, and the RSI remains below the mid-level. Nevertheless, the strong support remains at $68, which could limit further declines in the near term.

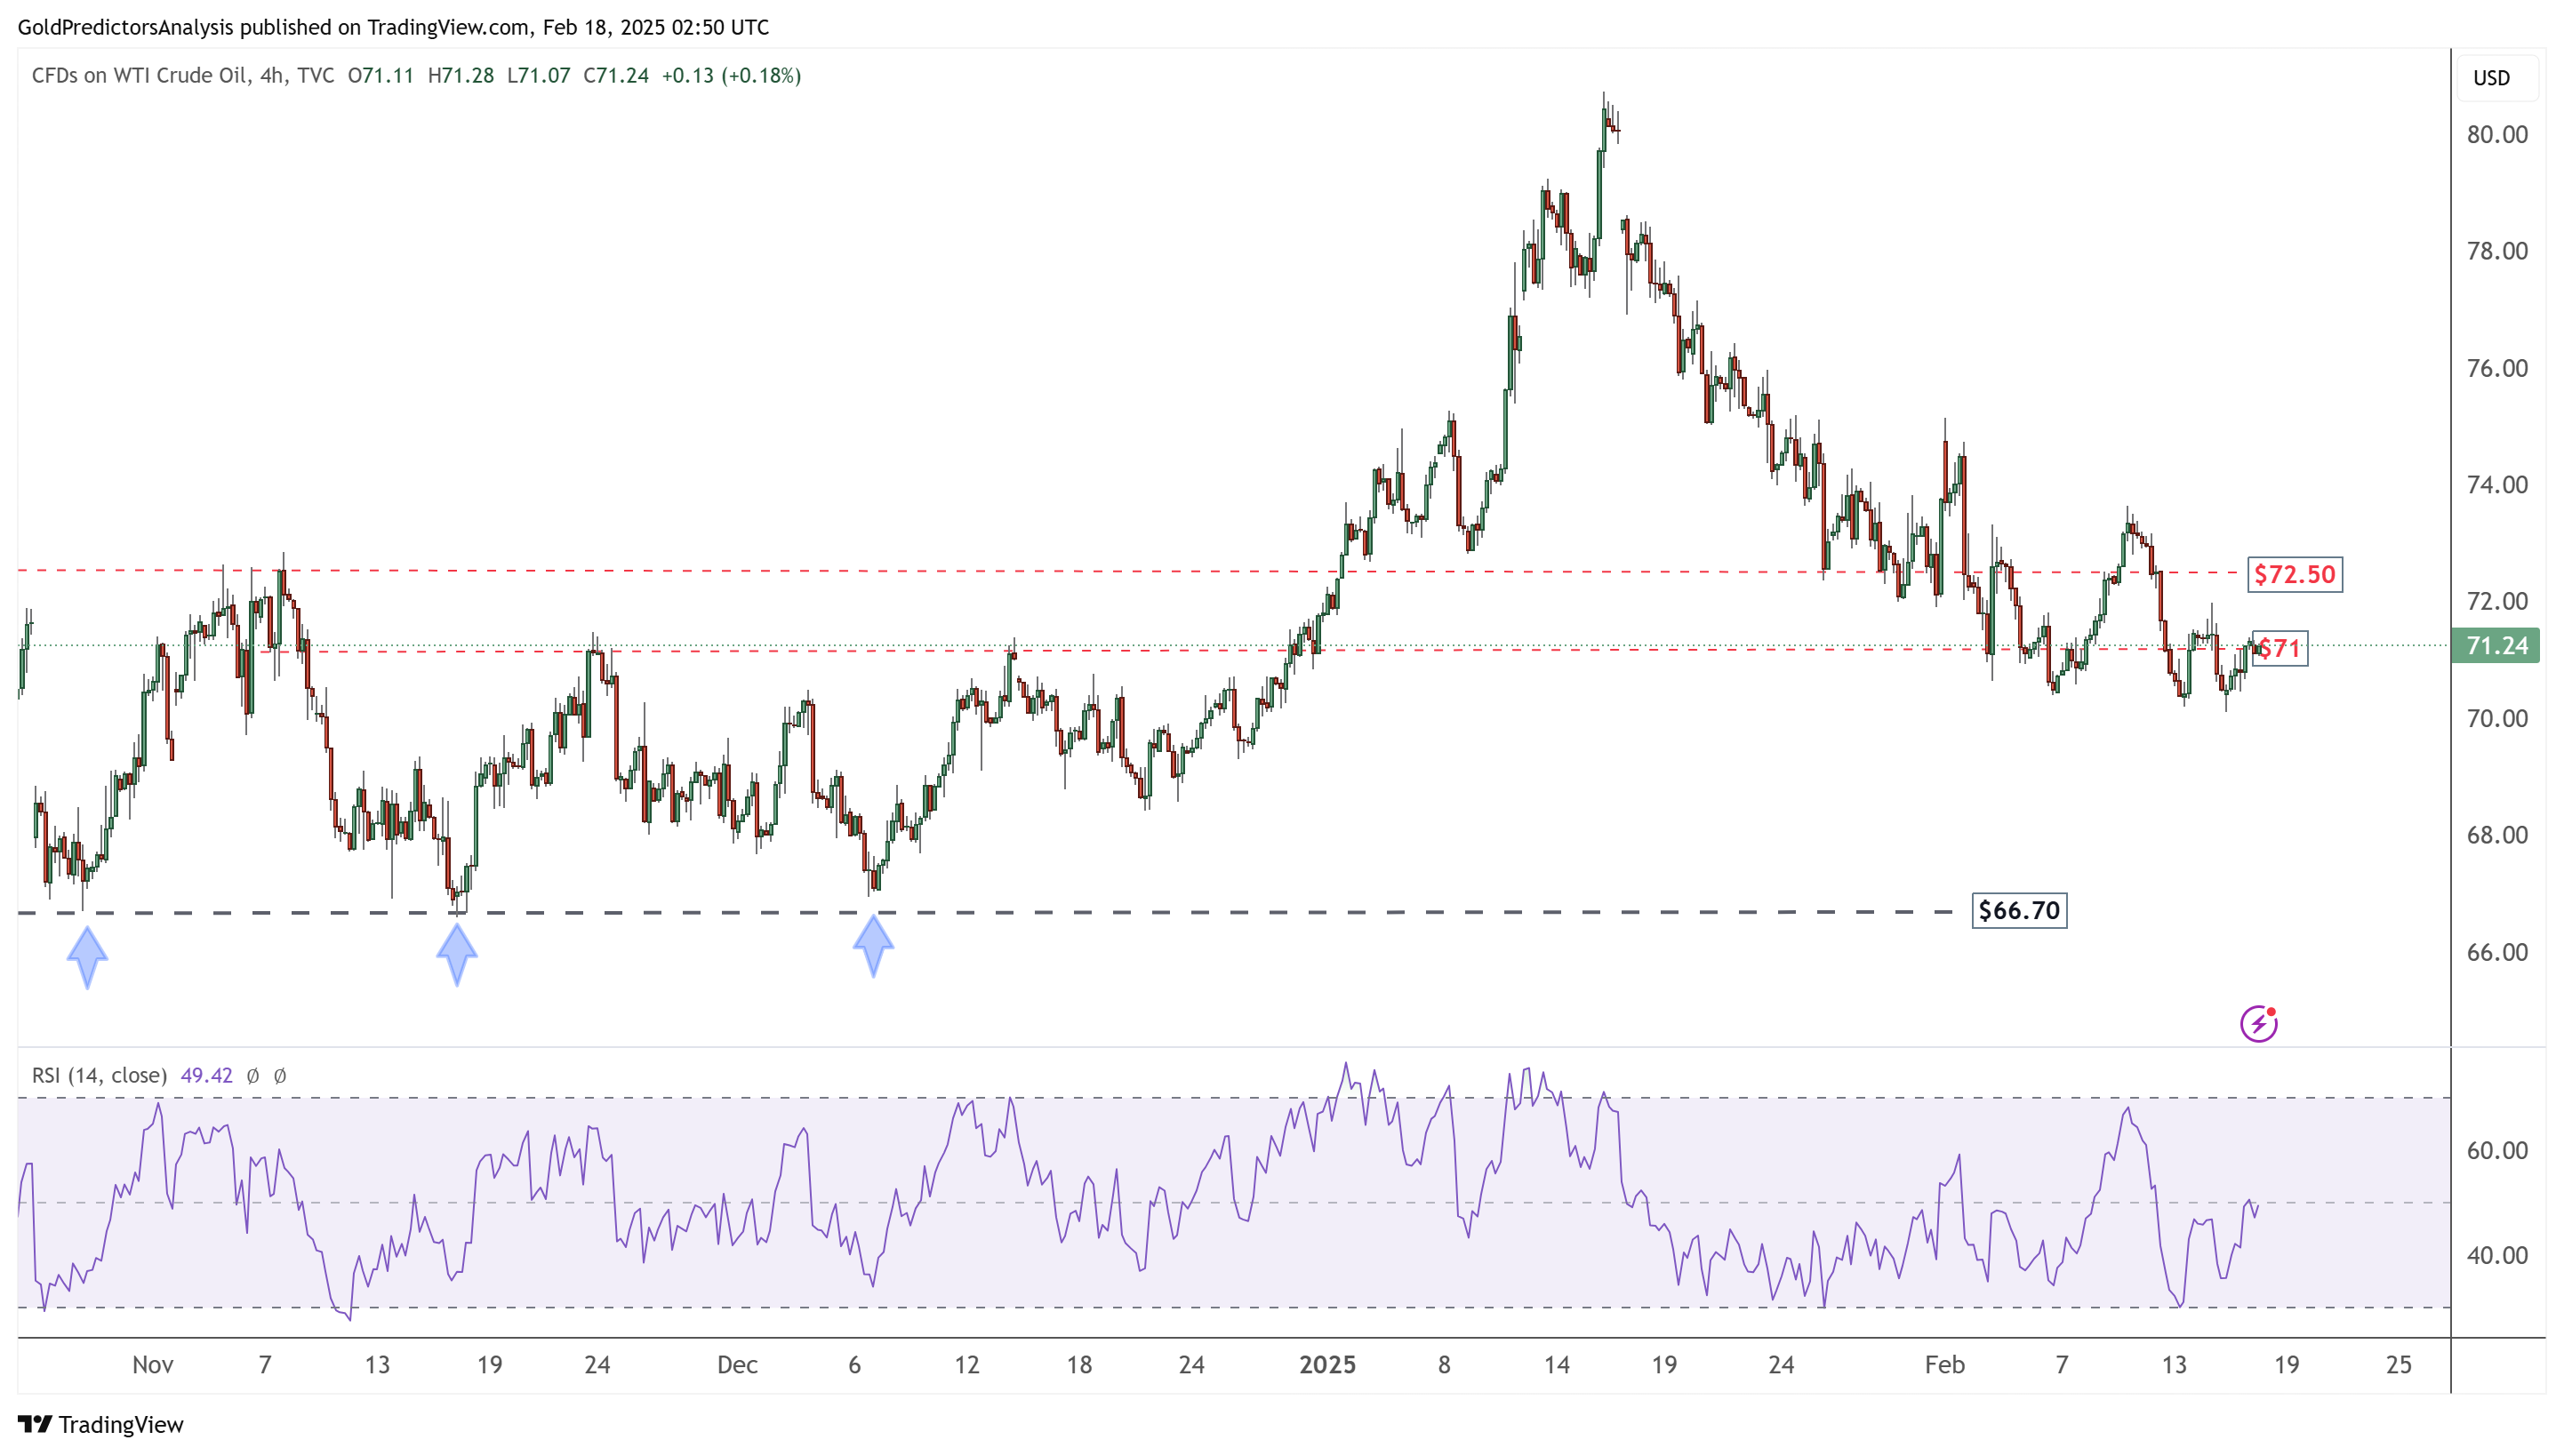
Oil 4-Hour Chart – Bearish Pressure
The 4-hour chart shows price fluctuations below the support levels of $72.50 and $71. A failure to break above $72.50 will keep WTI crude oil under pressure, with potential downside towards the $66 to $68 price levels.


