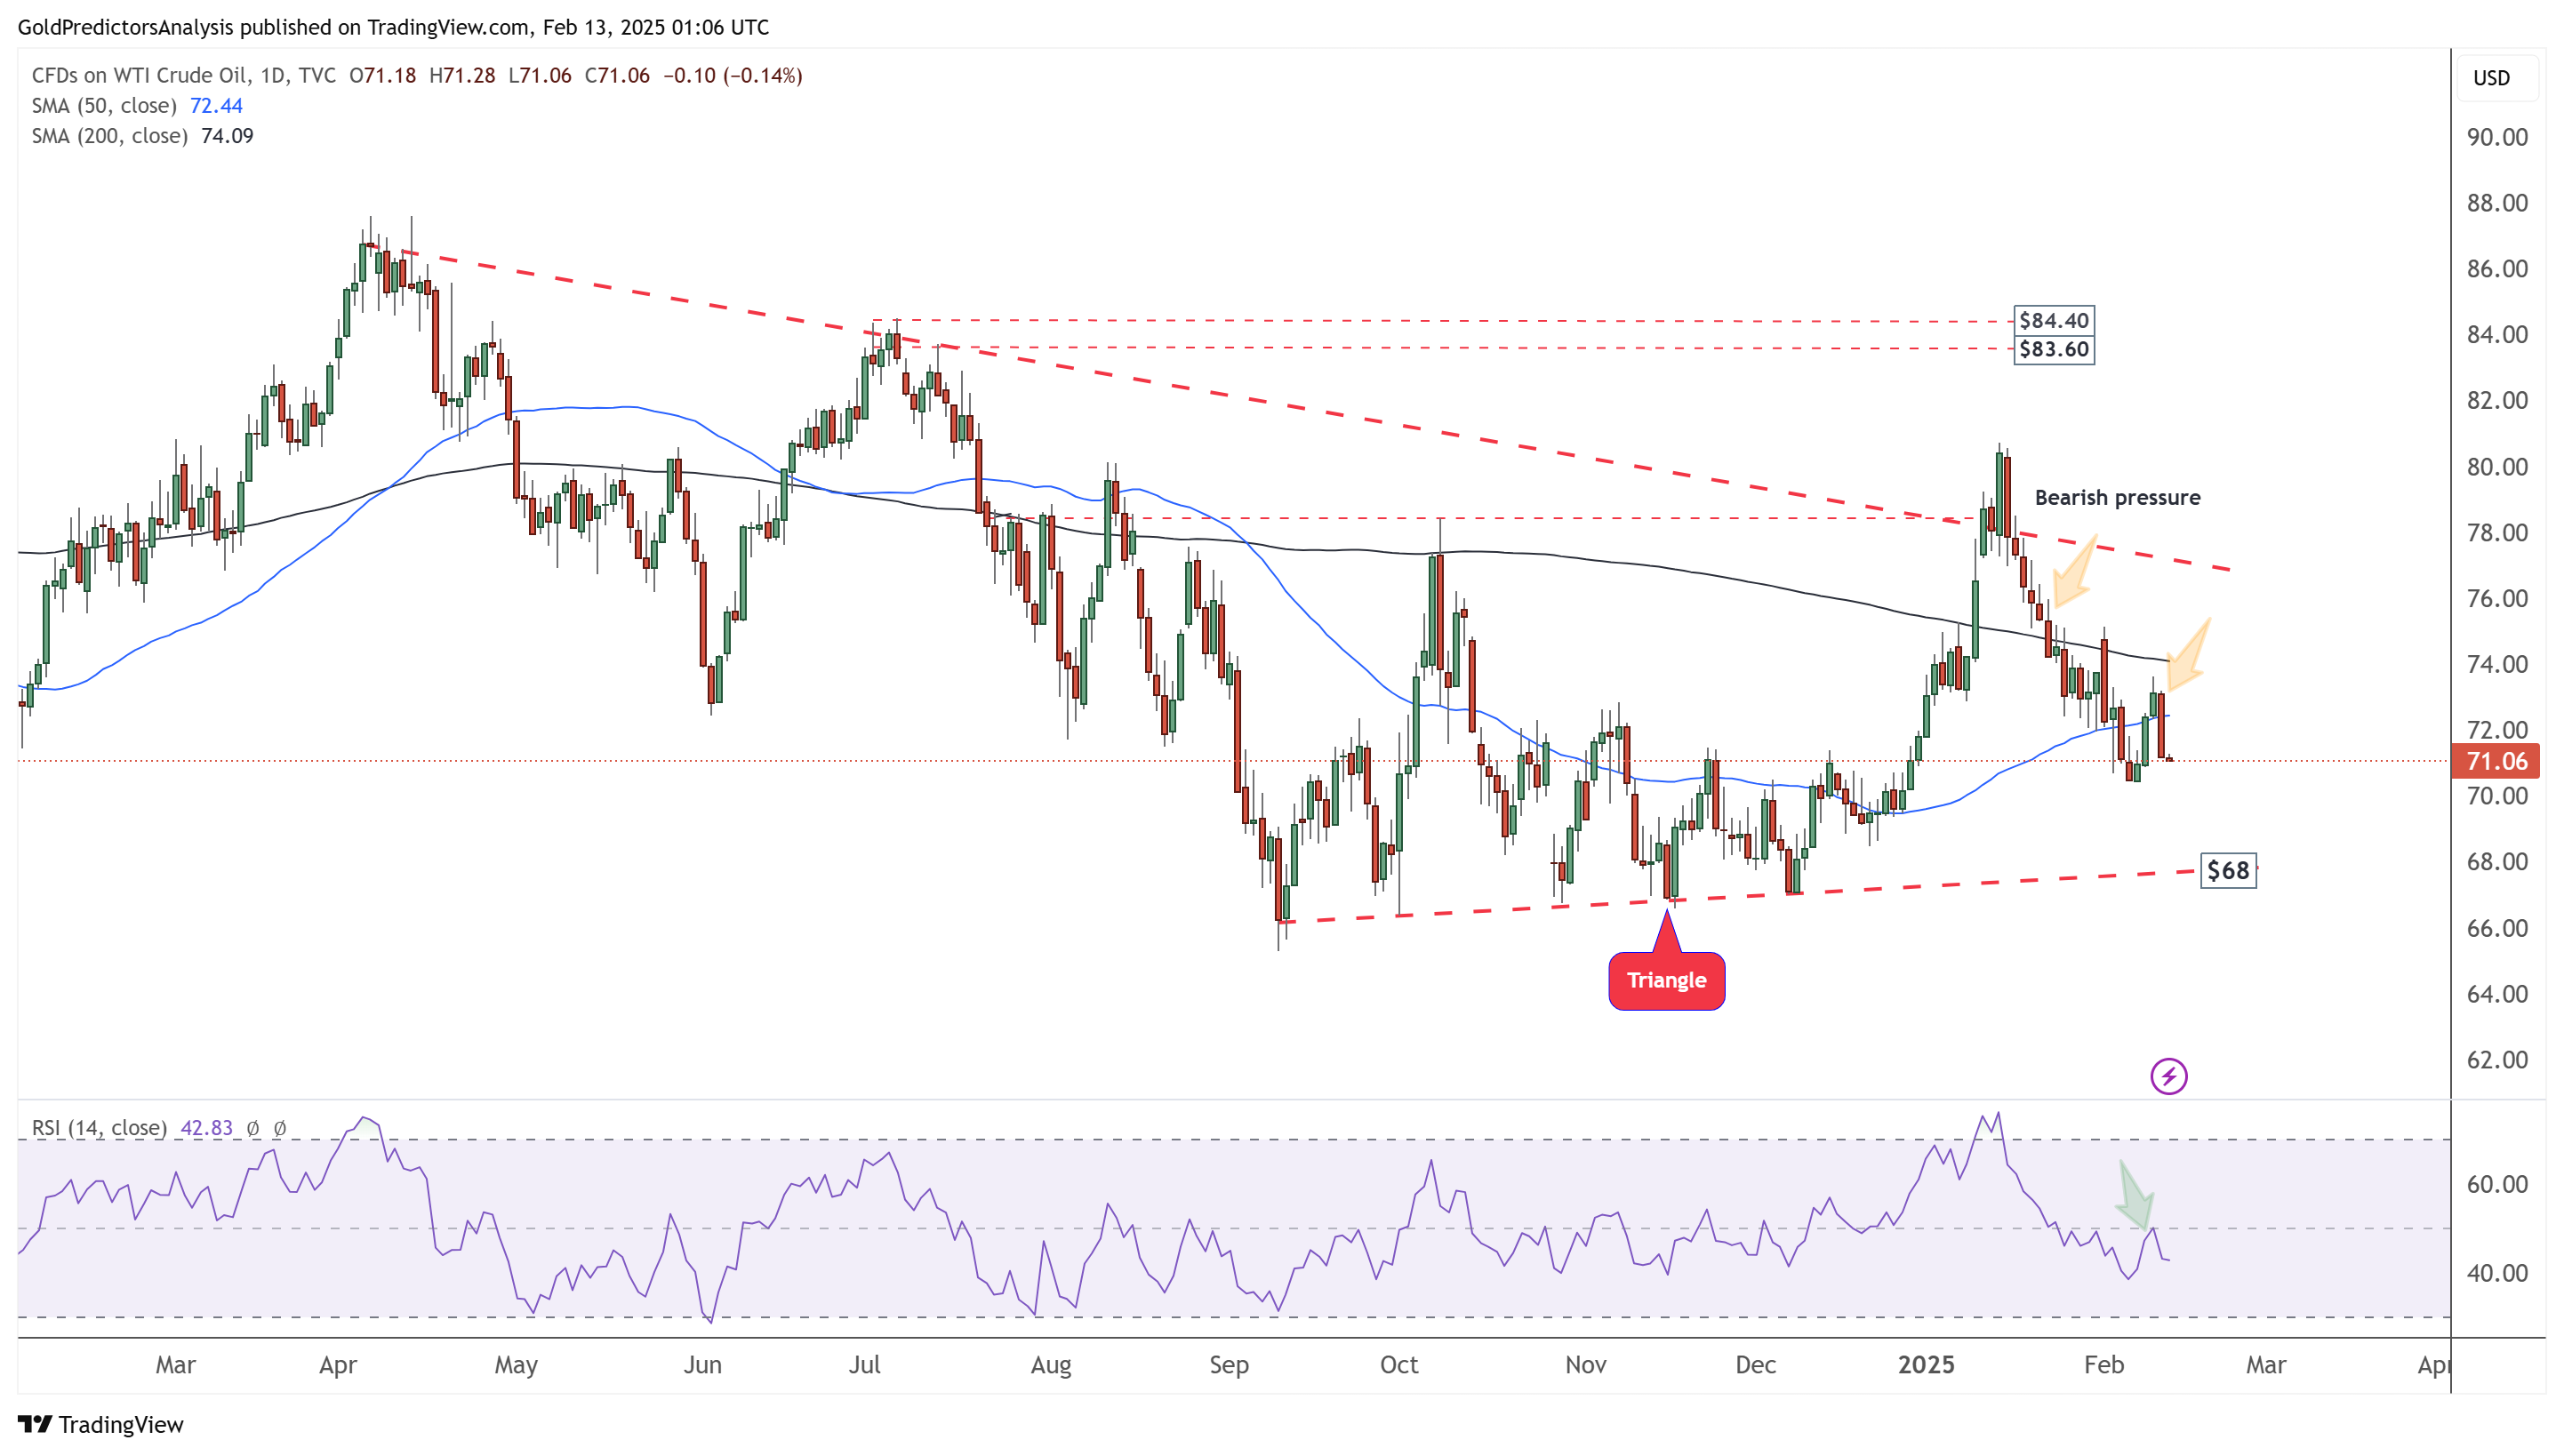
 Oil Daily Chart – Bearish Pressure
The daily chart for WTI crude oil shows that prices remain under bearish pressure. Prices continue to decline below the 50-day and 200-day SMA, moving toward the $68 support level. Moreover, the RSI is dropping from the mid-level, indicating further downside for oil prices. The continued trading below the 200-day SMA confirms the primary downtrend in the oil market.
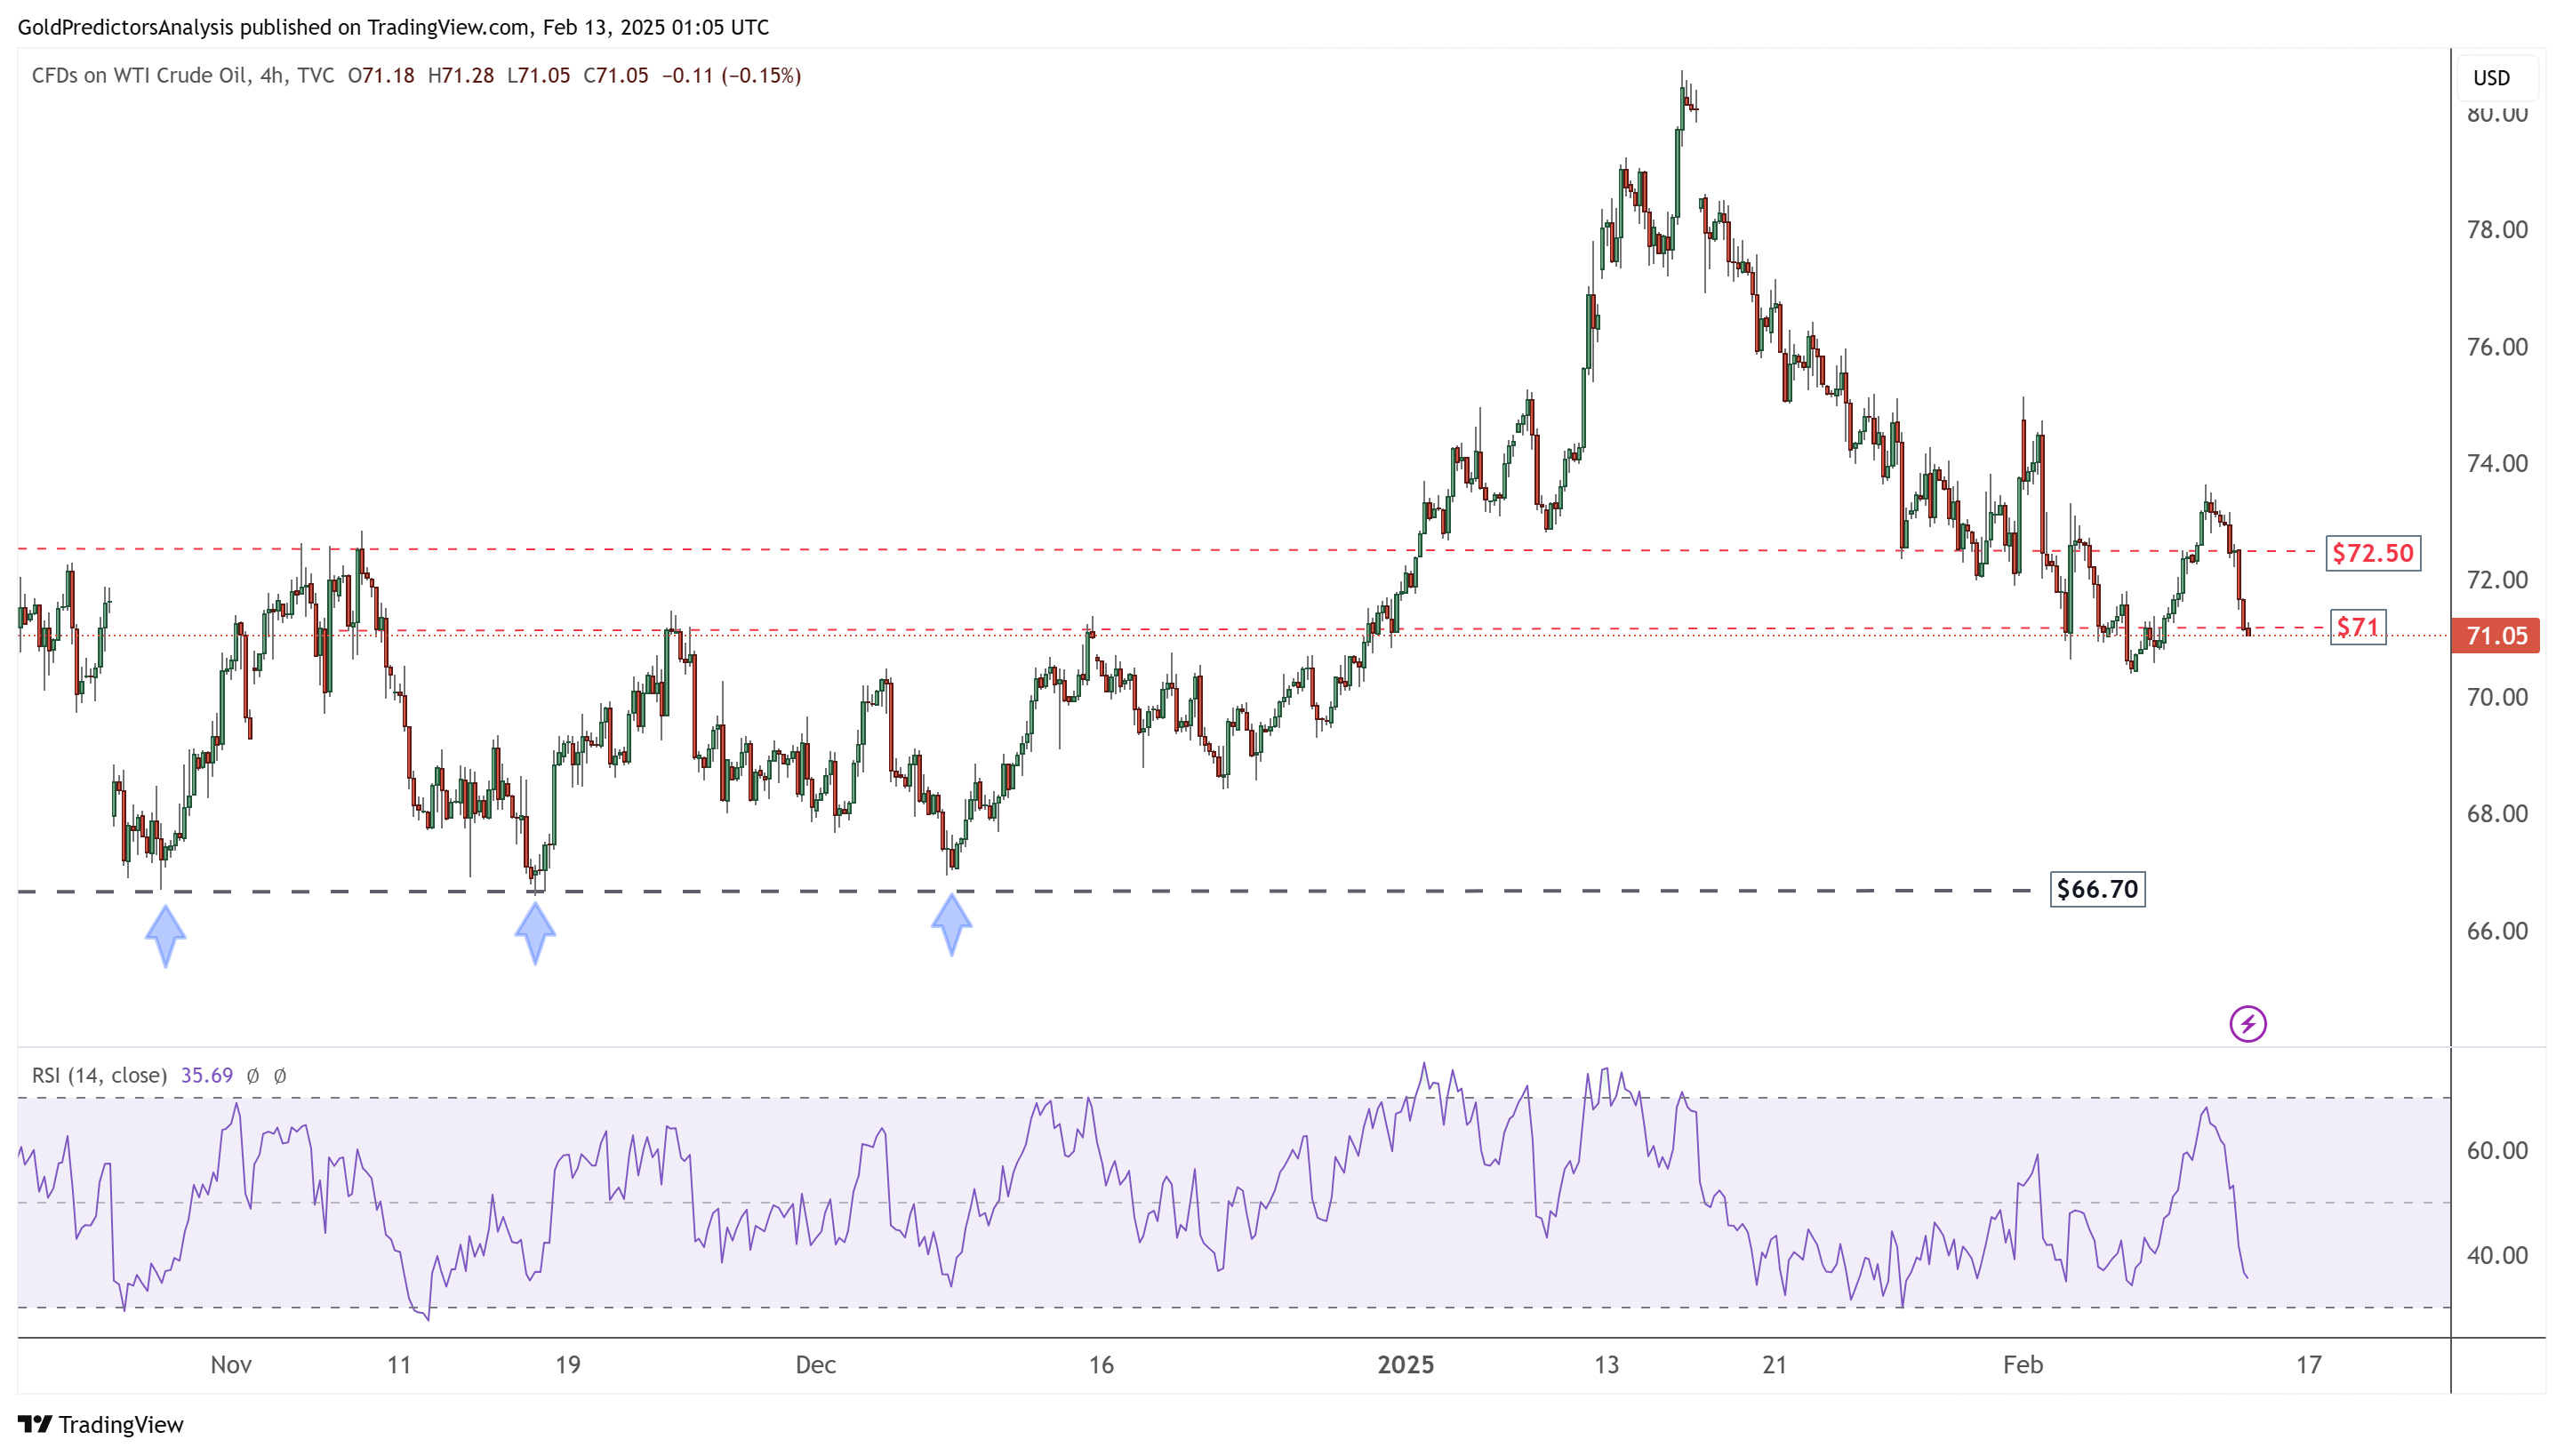
Oil 4-Hour Chart – Bearish Pressure
This bearish pressure is also evident on the 4-hour chart for WTI crude oil, where the price has broken below the $71 support area. A break below this level opens the door for a decline toward the $66-$68 price range. The RSI is falling sharply on the 4-hour chart, signalling the continuation of downside momentum in the oil market.