 Oil Daily Chart – Reversal
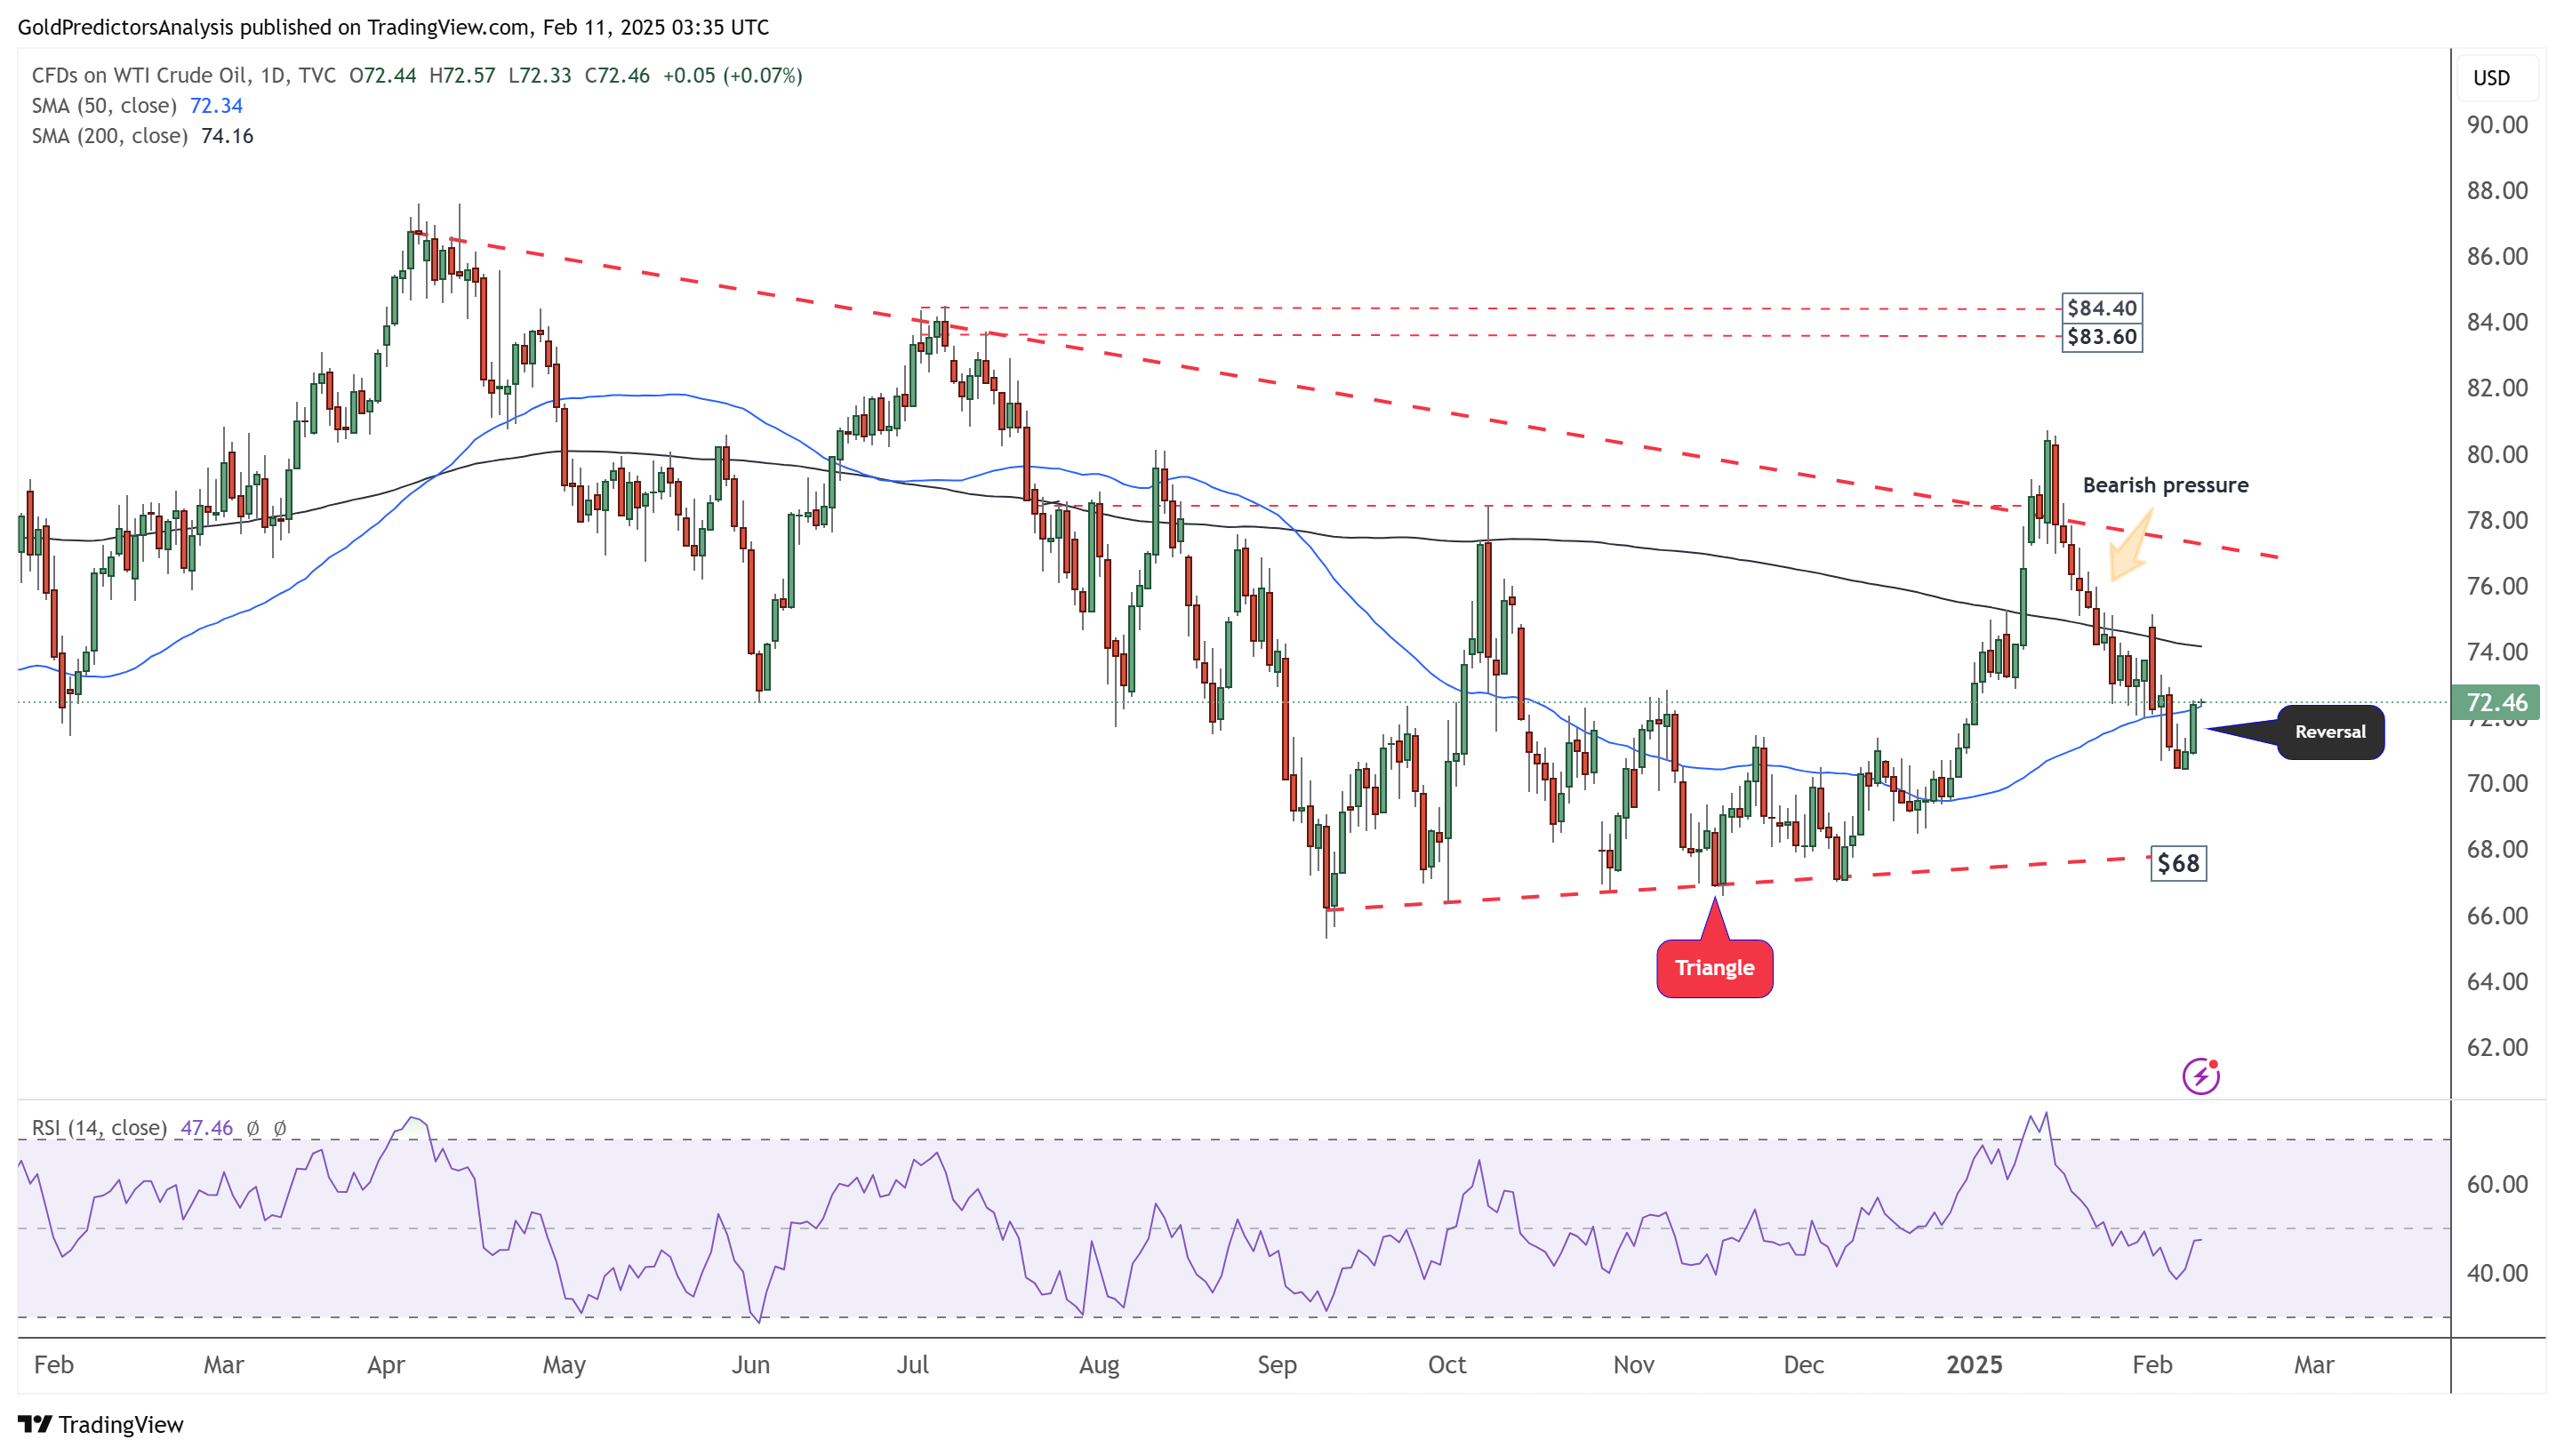
The daily chart for WTI crude oil shows a strong rebound initiated after the release of employment data last week. The price is breaking above the 50-day SMA, signalling a potential reversal. However, it remains within the wide range of a triangle formation between $68 and $80. As long as the price stays within this range, the oil market will likely fluctuate widely. A break above the 200-day SMA at $74.50 would indicate a bullish move toward $80. On the other hand, if WTI crude oil fails to break above the 200-day SMA and moves lower, the price will likely continue toward $68.