


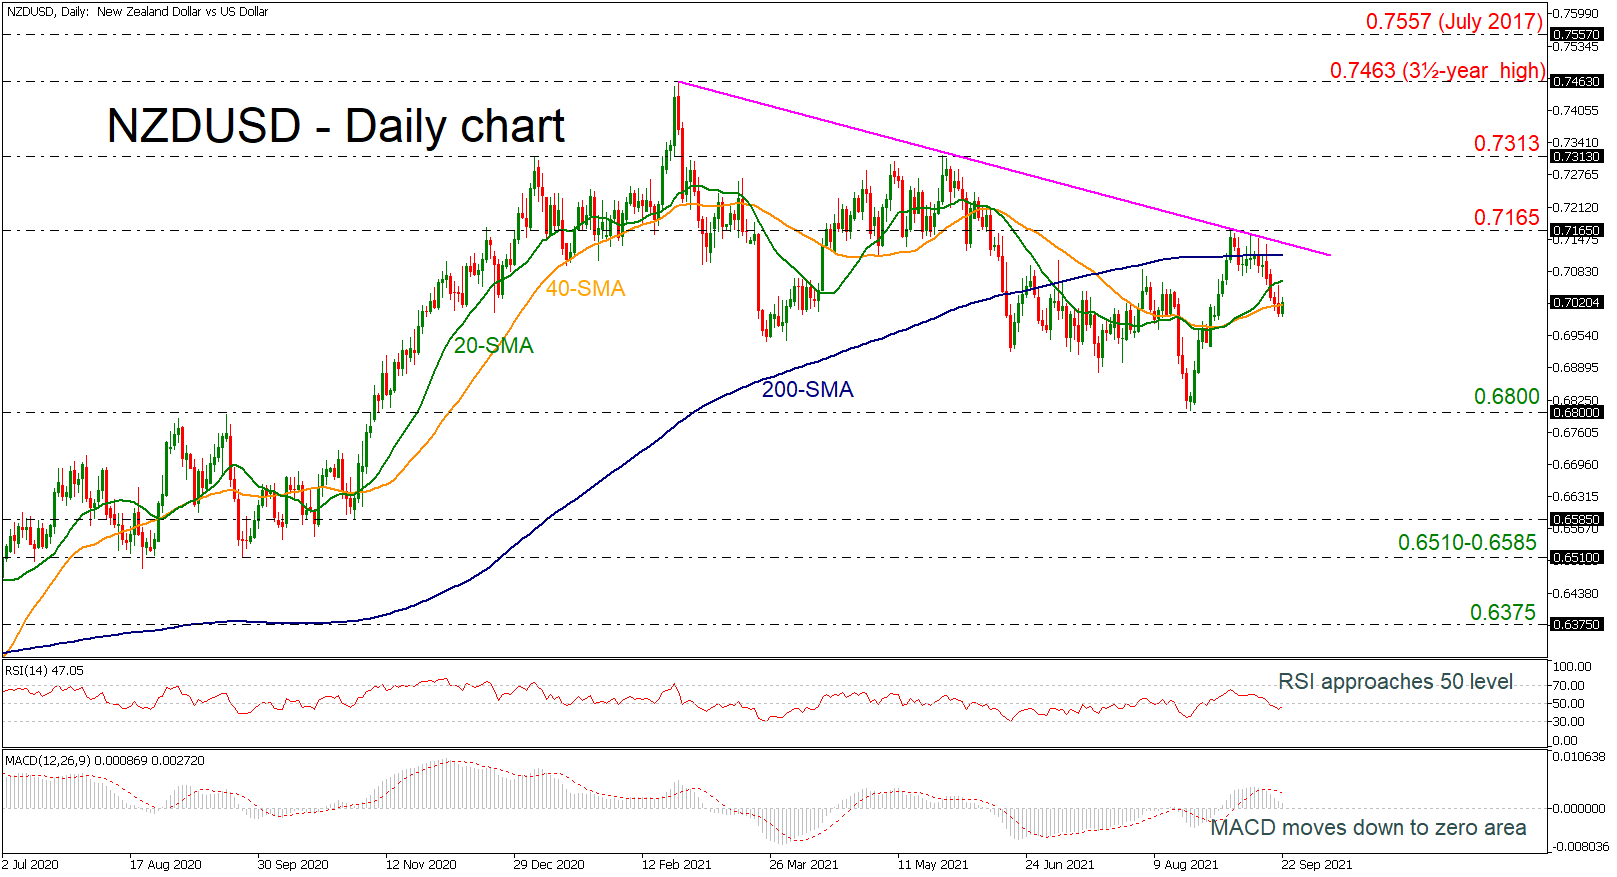
 NZDUSD is rising somewhat after it found strong resistance at the long-term descending trend line around the 0.7465 resistance. According to the SMAs, they are mainly promoting a neutral price development.
The technical indicators appear to be flat and are signaling weak and mixed indications in directional momentum. Positively, the RSI is attempting to improve in the bullish zone. The MACD oscillator is falling below its trigger line and near the zero level.
Sellers may find it difficult to close below the 40-day simple moving average (SMA) at 0.7016; however, if this happens, a zone of support might come from the 0.6800 handle. Steeper decreases may open the way for lower lows, taking the market until the 0.6510-0.6585 region.
On the other hand, the 200-day SMA at 0.7120 may act as a preliminarily upward-blocking obstacle before the resistance of 0.7165 comes into place. Breaking the falling trend line to the upside may shift the broader outlook to neutral, hitting 0.7313 and the 0.7463 crucial level.
It may be concluded that because NZDUSD is trapped between the 20- and 40-day SMAs, directional forces are weakening. However, a break above the 0.7165 resistance or below 0.6800 might lead to a new trading direction.
Origin: XM


