


 USDJPY is in a consolidation phase between two converging trendlines in the four-hour chart, moving sideways within the 110.21 – 109.40 area over the past week.
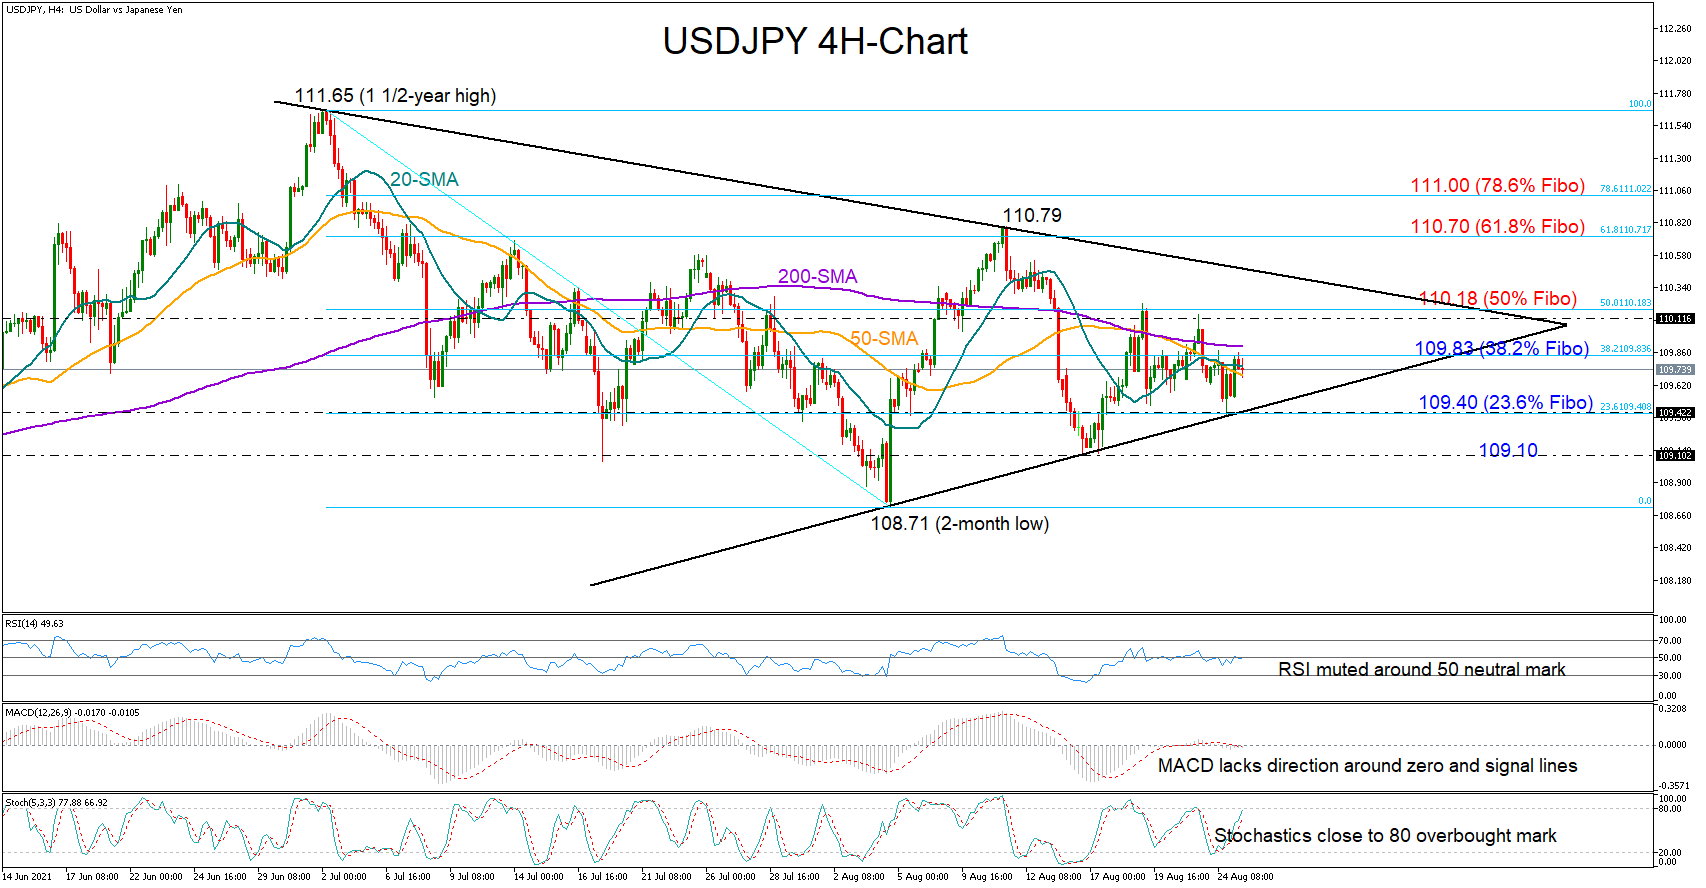
Encouragingly, the lower trendline managed to add strong footing under the price on Tuesday at 109.40, raising speculation that the pair could sail northwards again, but the 38.2% Fibonacci retracement of the 111.65 – 108.71 down leg came immediately to block the way higher on Wednesday at 109.83.
The momentum indicators are currently providing little hope for a meaningful upside correction as the RSI and the MACD remain in a tight range near their neutral levels, while the Stochastics have already reduced their distance with the 80 overbought level, flagging there is not much bullish fuel left in the tank.
Nevertheless, a close above the 38.2% Fibonacci of 109.83 and the 200-period simple moving average (SMA) is expected to drive the price up to the 50% Fibonacci of 110.18, a break of which could set off another intense battle near the upper trendline seen around 110.50. A successful move above the latter could magnify buying exposure in the market, shifting the spotlight towards the 61.8% and 78.6% Fibonacci levels at 110.70 and 110.00 respectively.
In the bearish scenario, if the price slides below the supportive trendline, where the 23.6% Fibonacci of 109.40 is also placed, the sell-off could speed up towards the previous low of 109.10. Failure to hold above the latter could bring the two-month low of 108.71 and therefore the case of a trend deterioration under examination.
Summarizing, USDJPY is holding a neutral bias in the short-term picture. A trendline breakout is required to navigate the market accordingly.
Origin: XM


