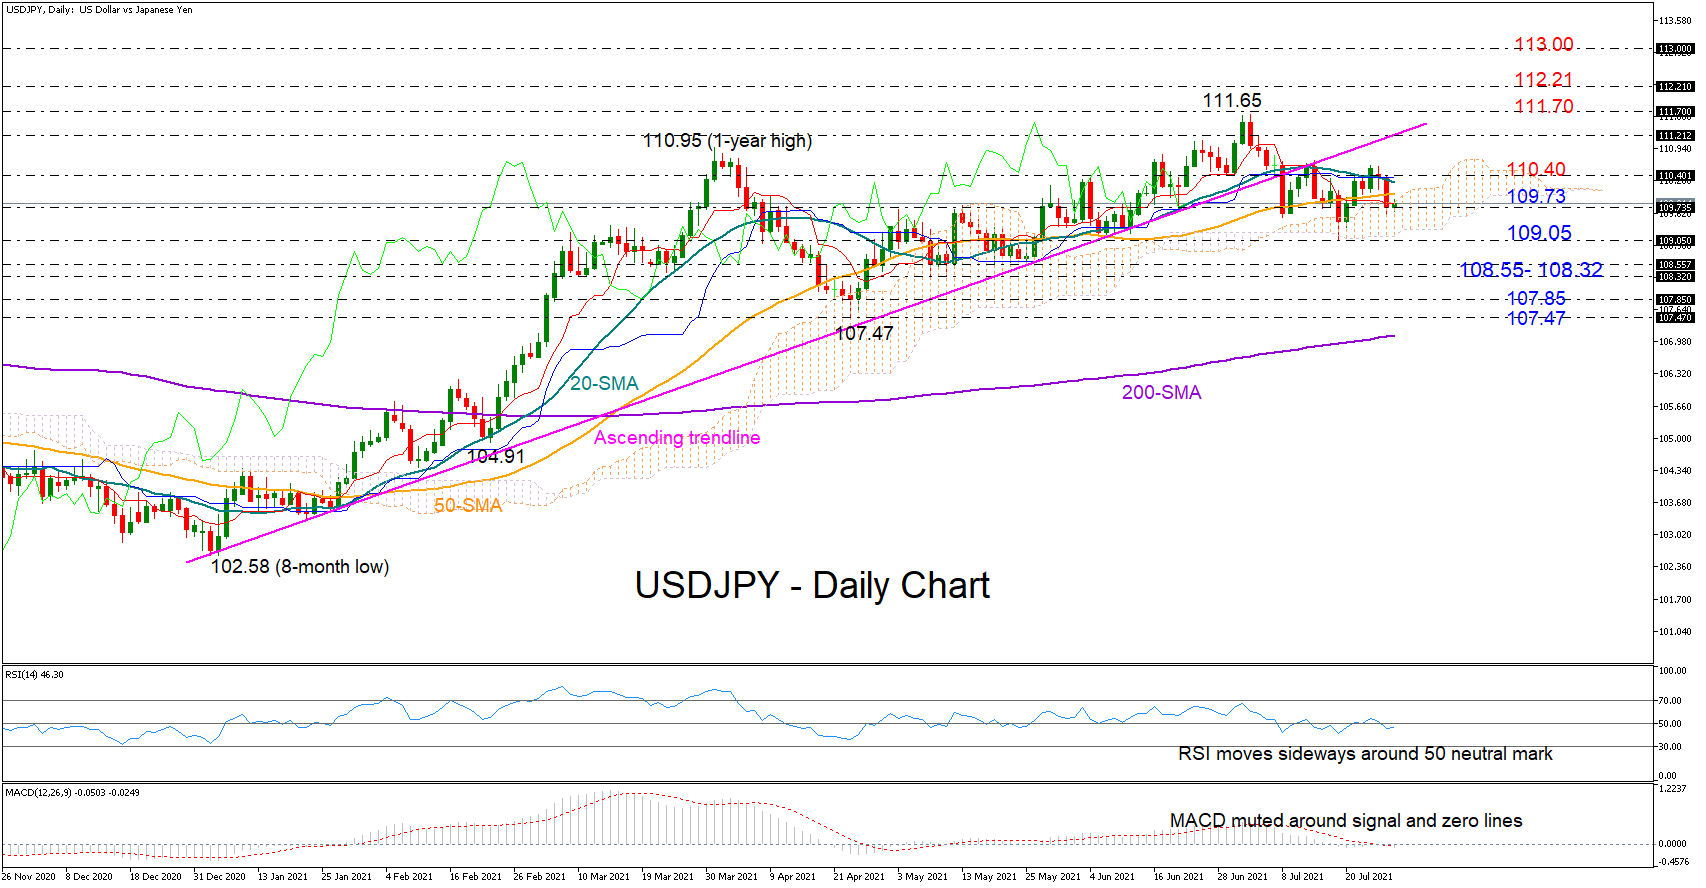
 USDJPY was capped by the 20-day simple moving average (SMA) around the 110.40 resistance area on Tuesday, with the price pulling back to seek support near the 109.73 number once again.
Previously, the crack below the long-term trendline forced the price into a sideways trajectory as the bounce at the bottom of the Ichimoku cloud at 109.05 withered the potential of sharper declines. With the RSI swinging around its 50 neutral mark and the MACD holding muted around its zero and signal lines, expectations are for the pair to maintain its trendless direction in the short-term picture.
Nevertheless, as the Fed policy announcement approaches, traders will be waiting for a close above the 20-day SMA and the 110.40 level before they target again the broken ascending trendline seen around 111.20. Slightly higher, the 111.70 – 112.21 resistance region, where the price topped in 2020, could build a tougher wall, blocking any move towards the 113.00 psychological level.
In the bearish scenario, a decisive step below the cloud and the 109.05 number would open the door for the 108.55 – 108.32 support zone. Breaching that floor too, the bears would aim for a close below the 107.85 – 107.47 area, which triggered April’s rebound, while not far below, the 200-day SMA may attract all the attention if sellers persist.
Summarizing, USDJPY is looking neutral in the short-term picture. The next round of volatility is expected to start above 110.40 or below 109.00.
Origin: XM