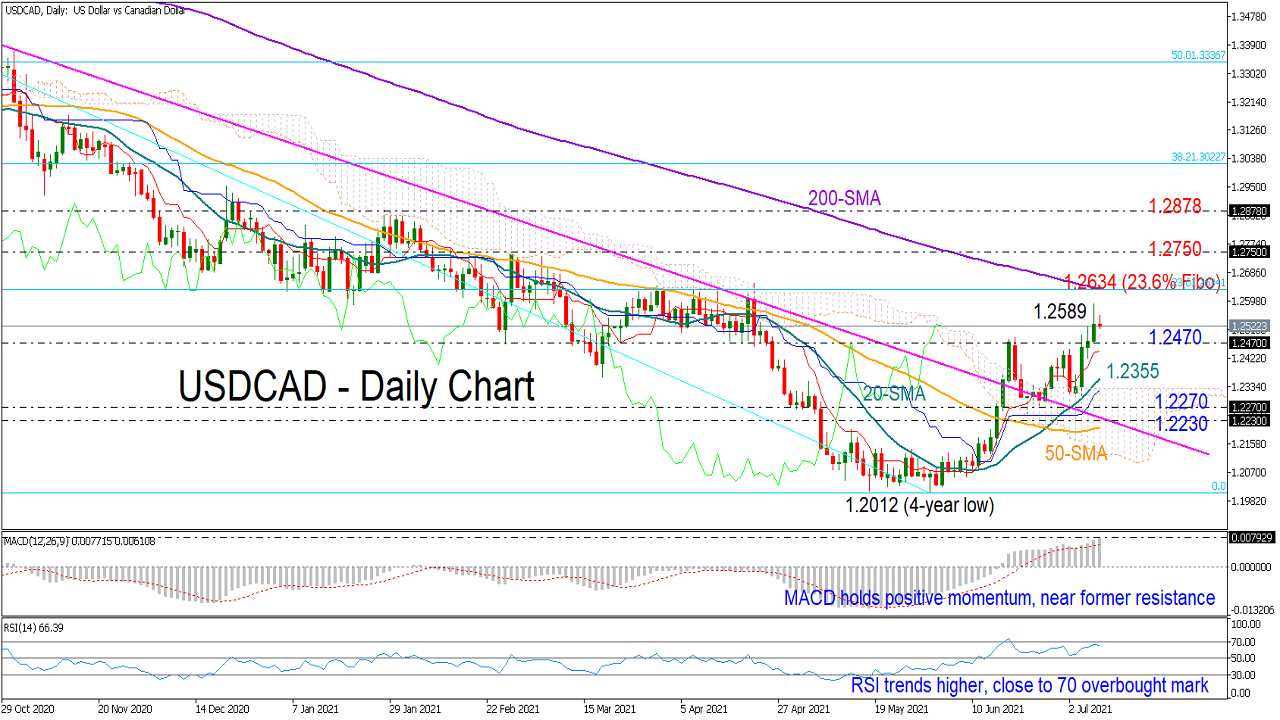
 USDCAD charted a new higher high at 1.2589 on Thursday, signaling that the trendline cracked in June could be something more than temporary.
The bullish cross between the 20- and 50-day simple moving averages (SMAs) is endorsing the above narrative but technically, a sustainable move above the previous high of 1.2652 is needed to invalidate the long-term downtrend and hence bring new buyers into the market. The 200-day SMA and the 23.6% Fibonacci retracement of the March 2020 – May 2021 downfall are in the neighborhood as well at 1.2634, enhancing the upward burden in the area.
More advances are possible according to the momentum indicators. However, any upside corrections should be taken with a grain of salt as the MACD is currently hovering around a former resistance region and the RSI is in short distance from its 70 overbought mark, warning that a pullback, perhaps around 1.2650, could occur.
If that is the case, the pair could reverse to seek support near 1.2470, while lower the 20-day SMA at 1.2355 may stop the price from testing the 1.2270 level. The broken descending trendline and the 50-day SMA could also adopt a protective role slightly beneath at 1.2230 if downside pressures strengthen.
Alternatively, if the 1.2652 area proves easy to claim, the next obstacle could pop up near 1.2750, whereas a sharper upturn could head for January’s peak of 1.2880.
In brief, USDCAD looks to have set up for more increases in the near term, though room for improvement could be limited as the price is approaching overbought levels.
Origin: XM