


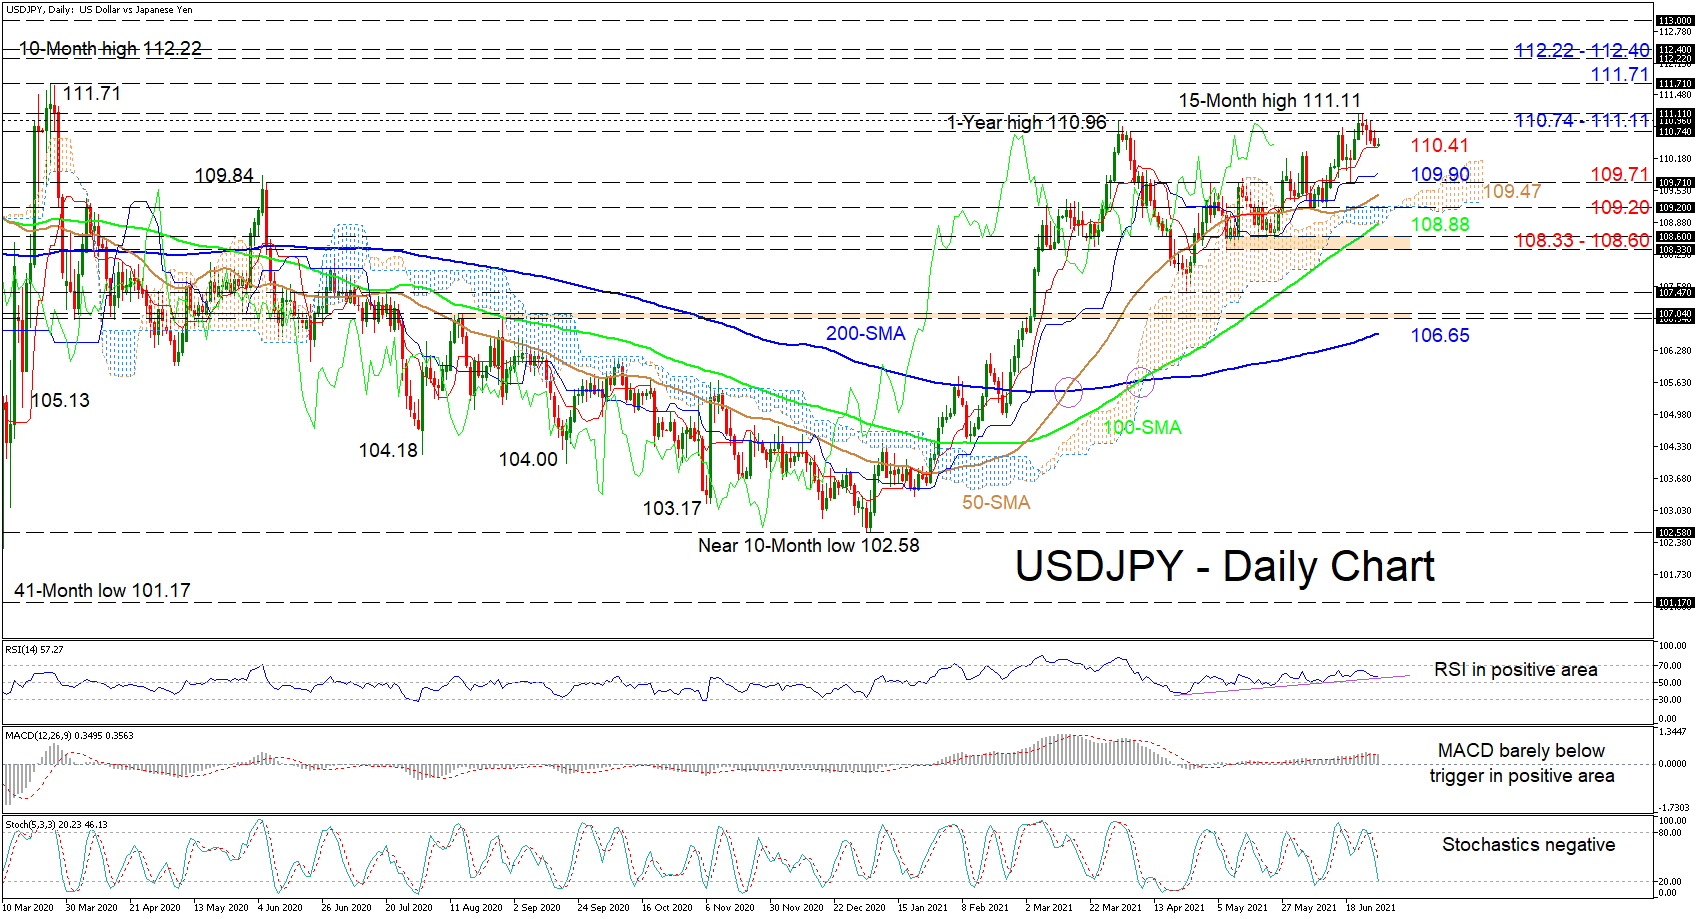
 USDJPY is finding its feet at the red Tenkan-sen line at 110.41 after fading from its latest clocked 15-month high of 111.11. The two-month positive structure’s bullish defences are becoming clearer now with the pair shaping higher lows and highs above the rising simple moving averages (SMAs).
The Ichimoku lines are indicating that bullish momentum is taking a breather, while the short-term oscillators are transmitting mixed signals in relation to the price’s directional preference. The MACD is above zero and has marginally retracted beneath its red trigger line, while the RSI is looking for traction in the positive region, off a supportive trend line. At this point in time the negatively charged stochastic oscillator is endorsing an extension of the price’s recoil from the 111.11 level.
To the downside, dipping below the red Tenkan-sen line at 110.41, sellers may encounter a region of support between the blue Kijun-sen line at 109.90 until the 50-day SMA at 109.47, an area that also encompasses the 109.71 low. Additional dwindling in price could then guide the pair to meet downside friction from the Ichimoku cloud and the 109.20 overlapping barrier. Should the negative trajectory gain pace, the 100-day SMA at 108.88 could quickly come into focus before sellers challenge the support section of 108.33-108.60, formed between the troughs during May.
If buyers mould strong traction off the red Tenkan-sen line at 110.41, right at their doorstep is the tough resistance zone of 110.74 until 111.11. Conquering this vital border, which encapsulates the 1-year high of 110.96, could then prompt buyers to target the 111.71 rally peak from the end of March 2020. Should buyers knock this high out of the park too, the next upside limitations could emanate from a boundary formed between the rally peaks of February 2020 and April 2019 of 112.22 and 112.40 respectively.
Summarizing, USDJPY is holding a sturdy two-month ascent from the 107.47 trough and a step above 111.11 would reinforce it. However, a dip below 109.71 could delay the bullish outlook.
Origin: XM


