 USDJPY has formed a higher low around the mid-Bollinger band and the 50-day simple moving average (SMA), keeping the minor uptrend alive, which began from the 107.47 trough. The 100- and 200-day SMAs are backing improvements in the pair, while the short-term oscillators are signalling that positive sentiment may be picking up.
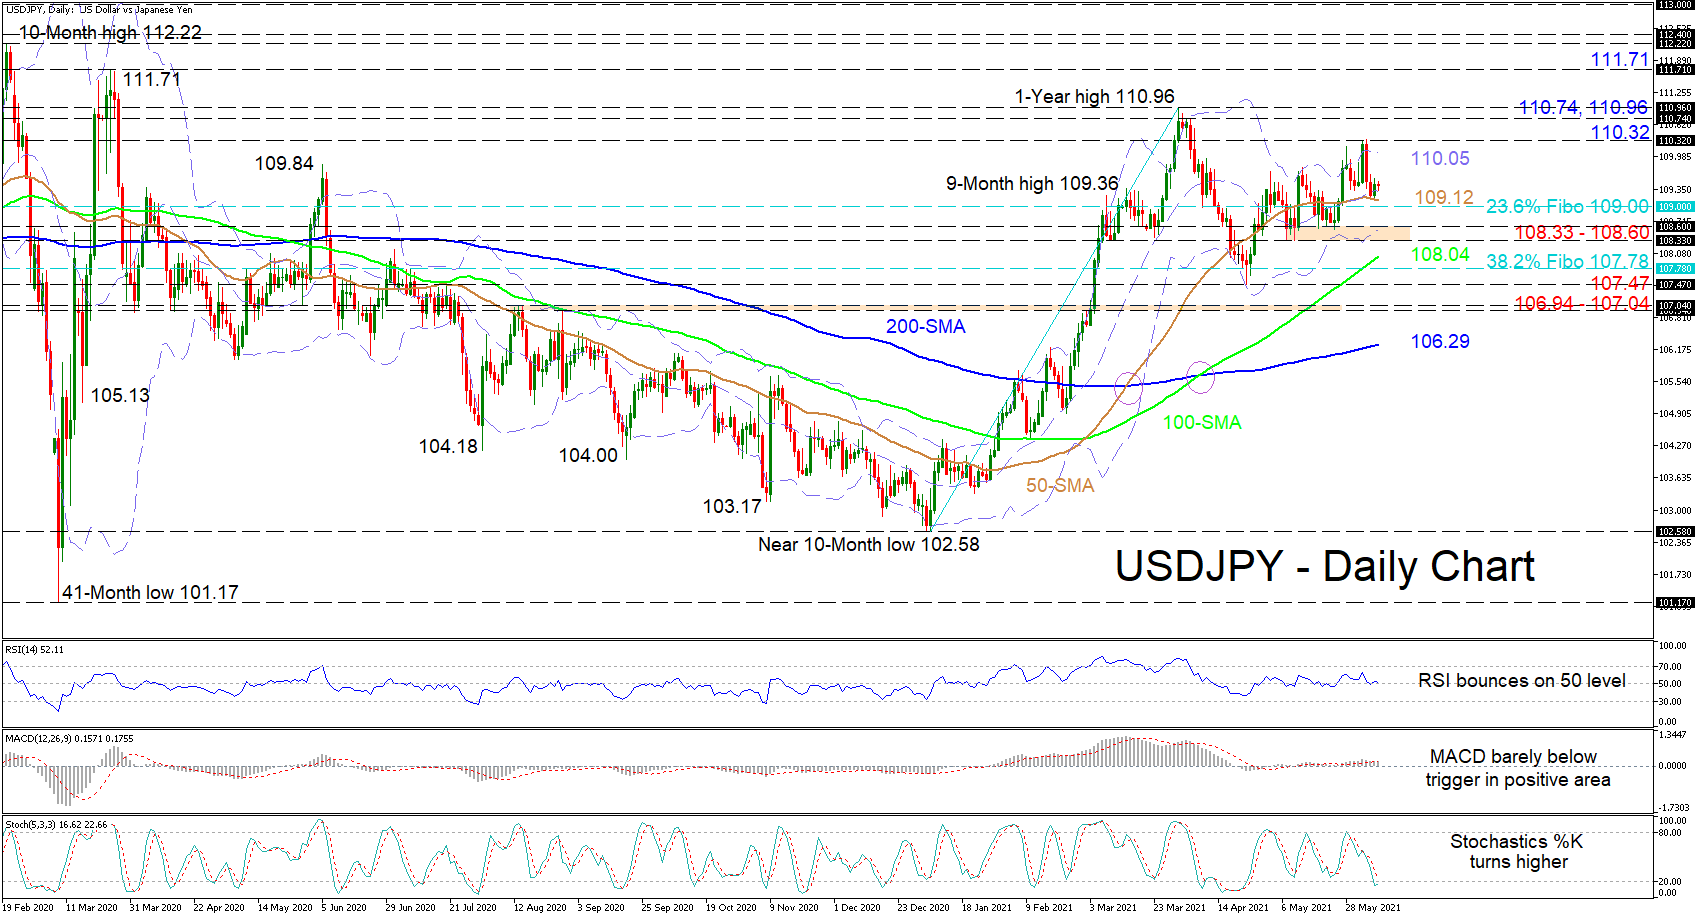
The MACD, in the bullish region, is barely beneath its flattened red trigger line, while the RSI is trying to sustain its bounce off the 50 level. The stochastic %K line, currently in oversold territory, is improving, indicating strengthening positive momentum.
If the pair’s traction off the 50-day SMA at 109.12 propels the price up, initial resistance could occur at the upper Bollinger band at 110.05 before buyers encounter the 110.32 nearby high. Overstepping this too, the bulls may then challenge the 110.74 and 110.96 barriers. Triumphing over these obstacles, the latter being a 1-year peak could encourage buyers to pilot for the vital 111.71 border, achieved around the end of March 2020.
If sellers resurface, they will need to succeed in driving the price below the mid-Bollinger band, the 50-day SMA at 109.12 and the adjacent 109.00 handle, which happens to be the 23.6% Fibonacci retracement of the up leg from 102.58 until 110.96. Dipping below the 109.00 mark, the pair may quickly target the support base of 108.33-108.60, fortified by the lower Bollinger band. Should this durable boundary fail to dismiss a deeper decline, the price may then hit the 100-day SMA at 108.04, while sellers may remain focused on a support zone between the 38.2% Fibo of 107.78 and the 107.47 trough.
In conclusion, USDJPY is sustaining a positive tone above the SMAs and the 108.33-108.60 frontier. That said, a break above 110.96 could boost the bullish bias, while a break below 106.94-107.04 could significantly reinforce negative tendencies.
Origin: XM