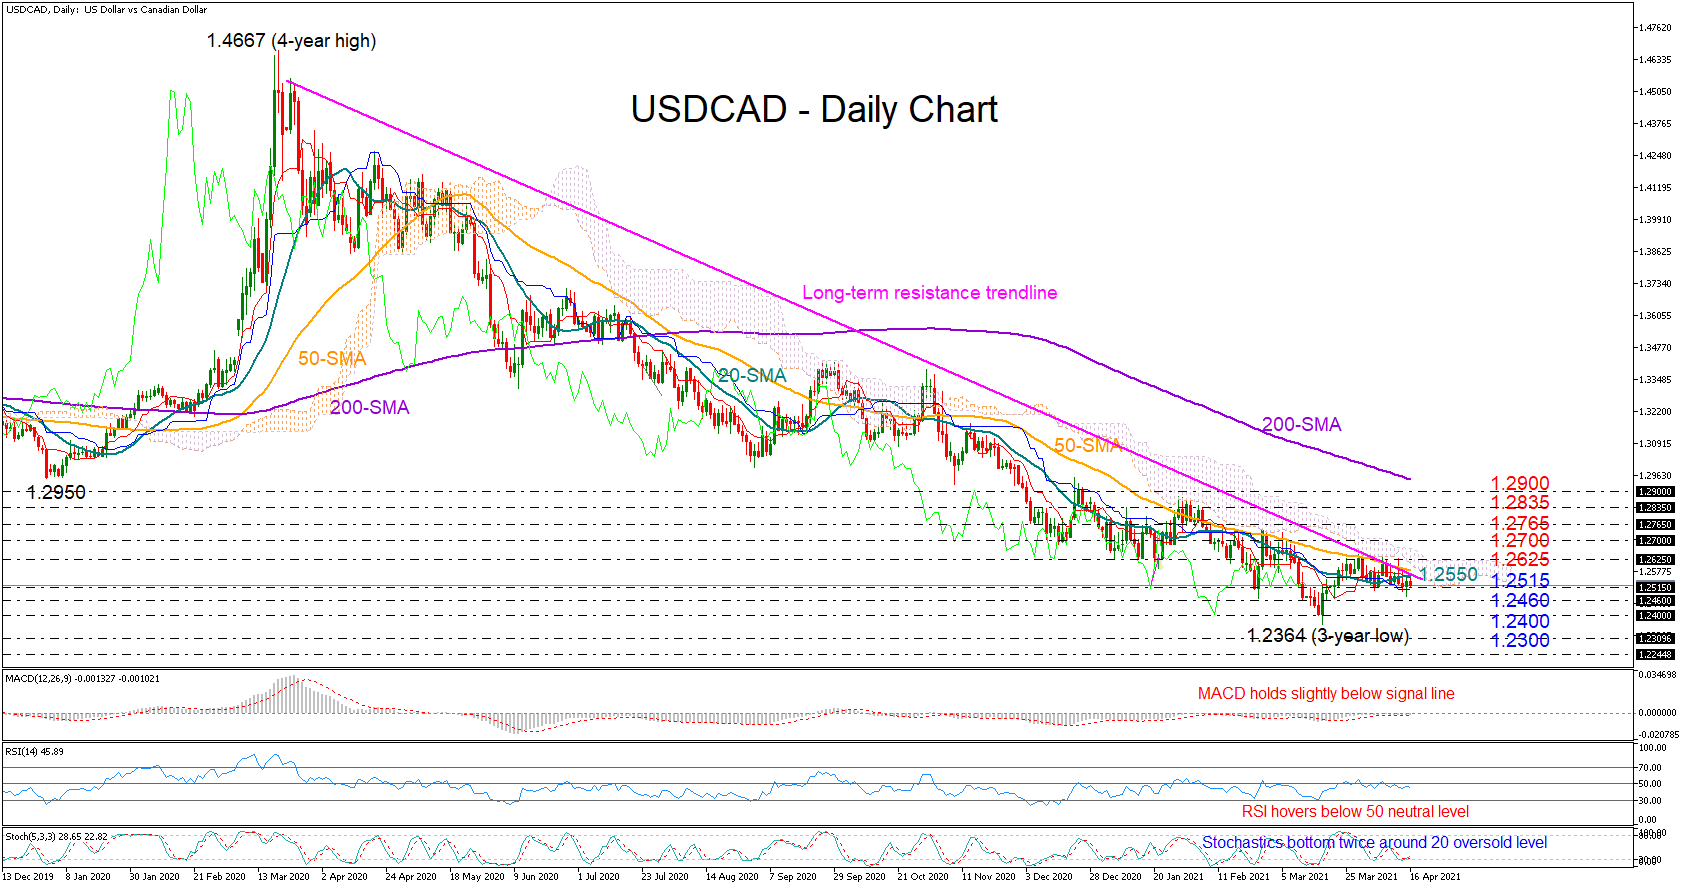
USDCAD remained stuck below the long-term descending trendline and under the Ichimoku cloud for another week, but encouragingly, the 1.2515 support held firm on the downside, rejecting any close lower despite the fall to 1.2475 on Thursday.
The latter strengthens the odds for an upside correction, with the Stochastics nicely backing this narrative too, as the indicator seems to have created a bullish double bottom around its 20 oversold mark. On the other hand, the RSI and the MACD keep hovering within the bearish territory, signalling that traders need extra motivation to set the stage for an upturn.
Obviously, buyers are calling for a sustainable move above the 1.2560 – 1.2625 zone, where the descending trendline, the shorter-term simple moving averages (SMAs) and the surface of the cloud all reside, to trigger the next bullish phase. If that is the case, the next burden could come within the 1.2700 – 1.2765 region, a break of which is expected to drive the price towards the 1.2835 – 1.2900 area, with the 200-day SMA likely adding extra downside pressure here.
Note that the bearish gap between the 20- and 50-day SMA has narrowed. A clear intersection between the lines could foresee the end of the downtrend in the short-term picture.
In the negative scenario where the price fails to close above the 20-day SMA at 1.2560, the bears may again attempt to reach the 1.2460 – 1.2400 zone. A drop below that floor would push for a new lower low around 1.2300 and then near 1.2250.
In brief, USDCAD is sending some bullish vibes in the short-term picture, though the bears may not give up the game unless the price rallies beyond the 1.2560 – 1.2625 area.
Origin: XM