


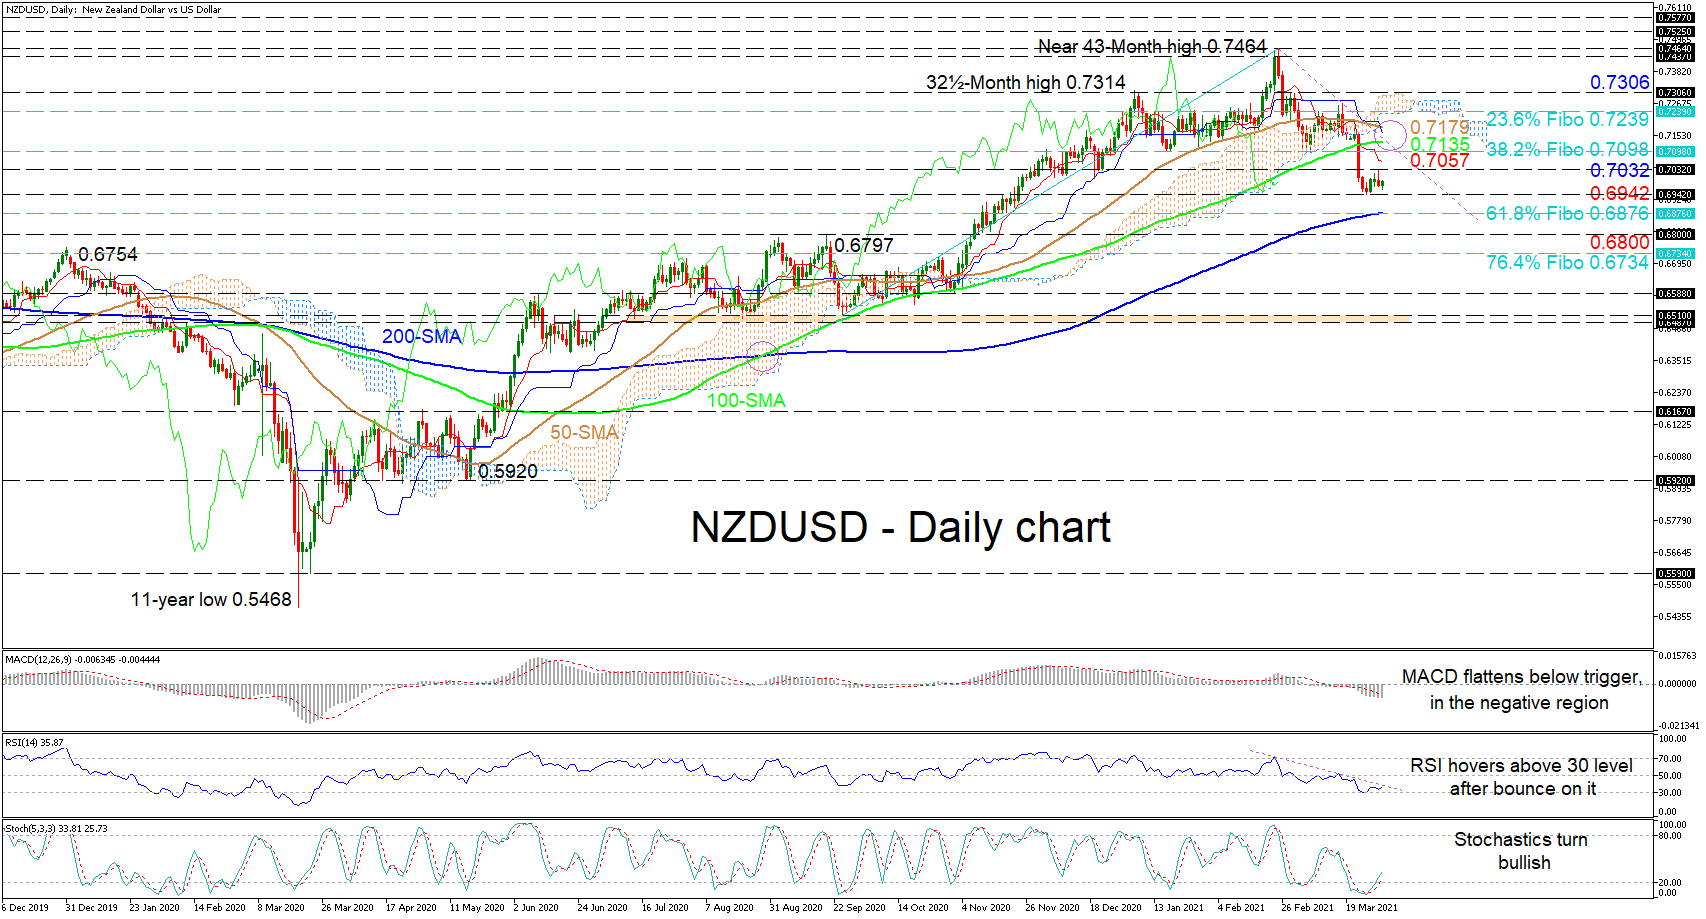
 NZDUSD’s negative impetus has abated slightly after a strong plunge and sellers seem to have taken the bench for a breather. The 200-day simple moving average (SMA) is defending the positive structure, while the dipping 50-day SMA is nearing a bearish crossover of the 100-day SMA, whose upwards trajectory is starting to wane.
The diving Ichimoku lines are signalling that negative momentum is set to resume, while the short-term oscillators are reflecting a decrease in the price’s downward potency. The MACD is below the zero mark but is flattening below the red trigger line, while the RSI, which is hovering above the 30 level, remains below a restrictive trend line. Furthermore, the stochastic oscillator has adopted a bullish tone favouring positive price action.
Immediate downside friction may commence from the 0.6942 low before sellers face the 200-day SMA residing at 0.6876, which also happens to be the 61.8% Fibonacci retracement of the up leg from 0.6510 to 0.7464. Should this barrier fail to negate the recent decline from the multi-year high of 0.7464, the price may challenge the key 0.6800 handle before meeting the 76.4% Fibo of 0.6734.
If buying interest intensifies, quick resistance could develop from the 0.7032 obstacle and the red Tenkan-sen line at 0.7057, ahead of the 38.2% Fibo of 0.7098. Should buyers ignore the yet to be confirmed restrictive trend line, they may meet a resistance zone from 0.7135 to 0.7179, located between the 100- and 50-day SMAs. Gaining further ground, the section from the 23.6% Fibo of 0.7239 until the 0.7306 high could prove to be a heavy boundary to overcome.
Summarizing, NZDUSD’s short-term picture remains skewed to the downside and a successfully completed bearish crossover of the 100-day SMA may reinforce this outlook.
Origin: XM


