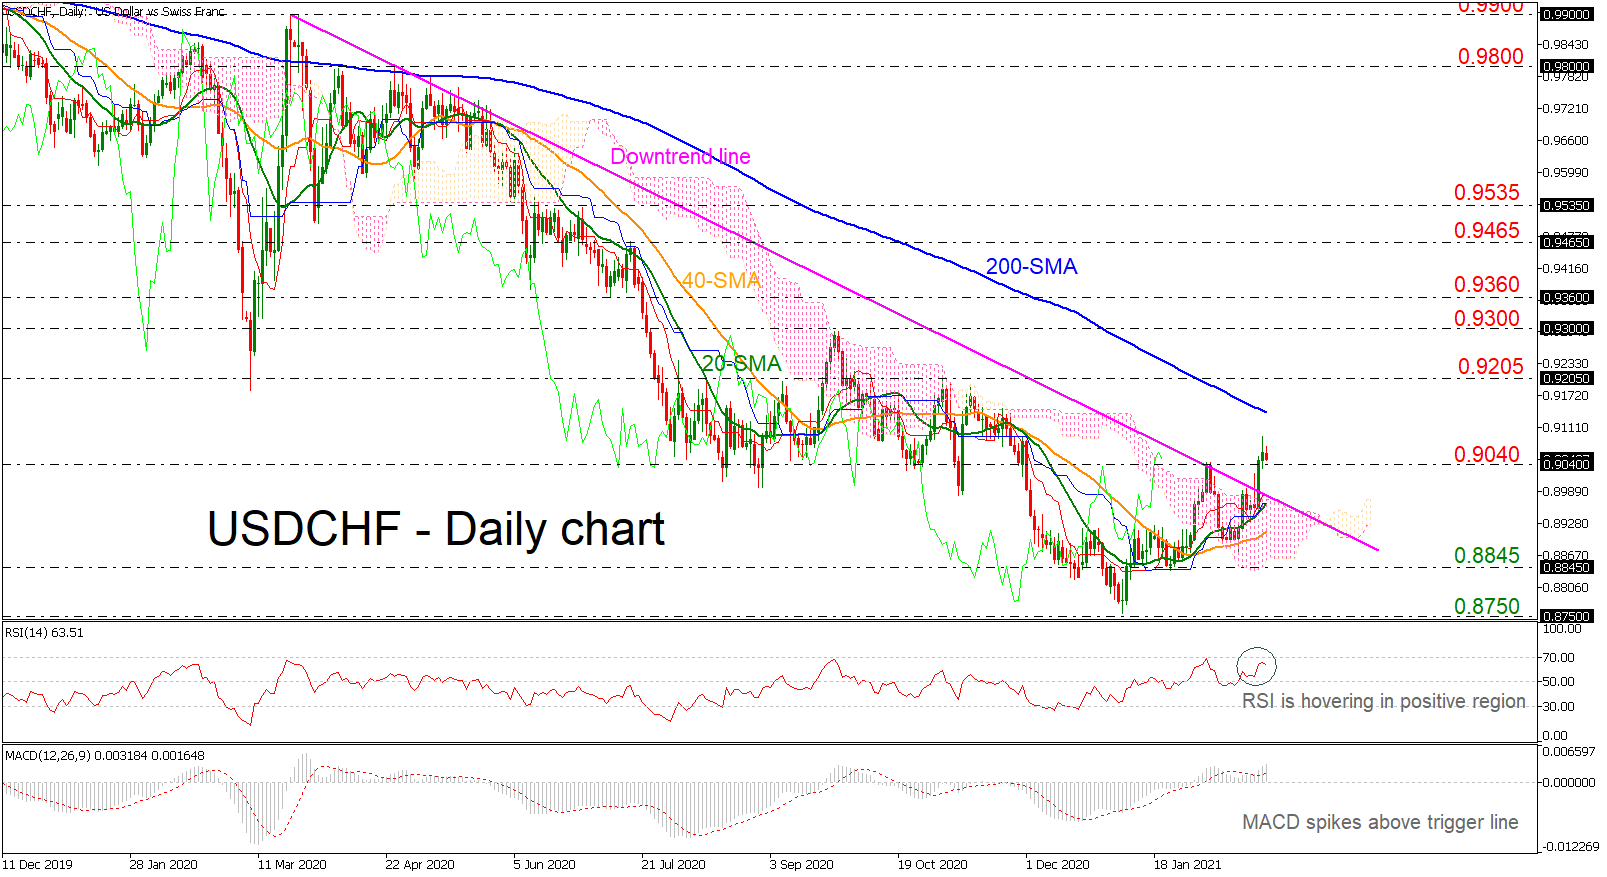
 USDCHF had an aggressive bullish start on Tuesday, with the price breaking a crucial descending trend line. The pair has also increased distance above its positively sloped moving average (MA) lines and the Ichimoku cloud, showing that a bearish correction is on the cards.
The momentum signals are bullish and the red Tenkan-sen line, which is above the blue Kijun-sen line, looks to be heading north, while the RSI has reversed higher and the MACD is advancing above its trigger and zero lines.
Should the price extend its increases, the 200-day simple moving average (SMA), currently at 0.9140, could be of psychological significance. Above that, the focus could shift straight to 0.9205 where the price posted a strong pullback in November 2020. If the latter permits for further gains, the next stop could be around the 0.9300 handle.
On the other hand, a bearish move could retest the 20- and 40-day SMAs at 0.8955 and 0.8900, respectively. Moving lower, the 0.8845 support could attract attention as the price paused several times in this zone in the past, while a slip below that region could last until 0.8750 and 0.8700 – the trough in March 2014.
Turning to the long-term picture, USDCHF is still in a negative trend despite the recent bullish move. For a bull market to develop though, traders need to wait for a clear close above the 200-day SMA and the 0.9300 round number.
Origin: XM