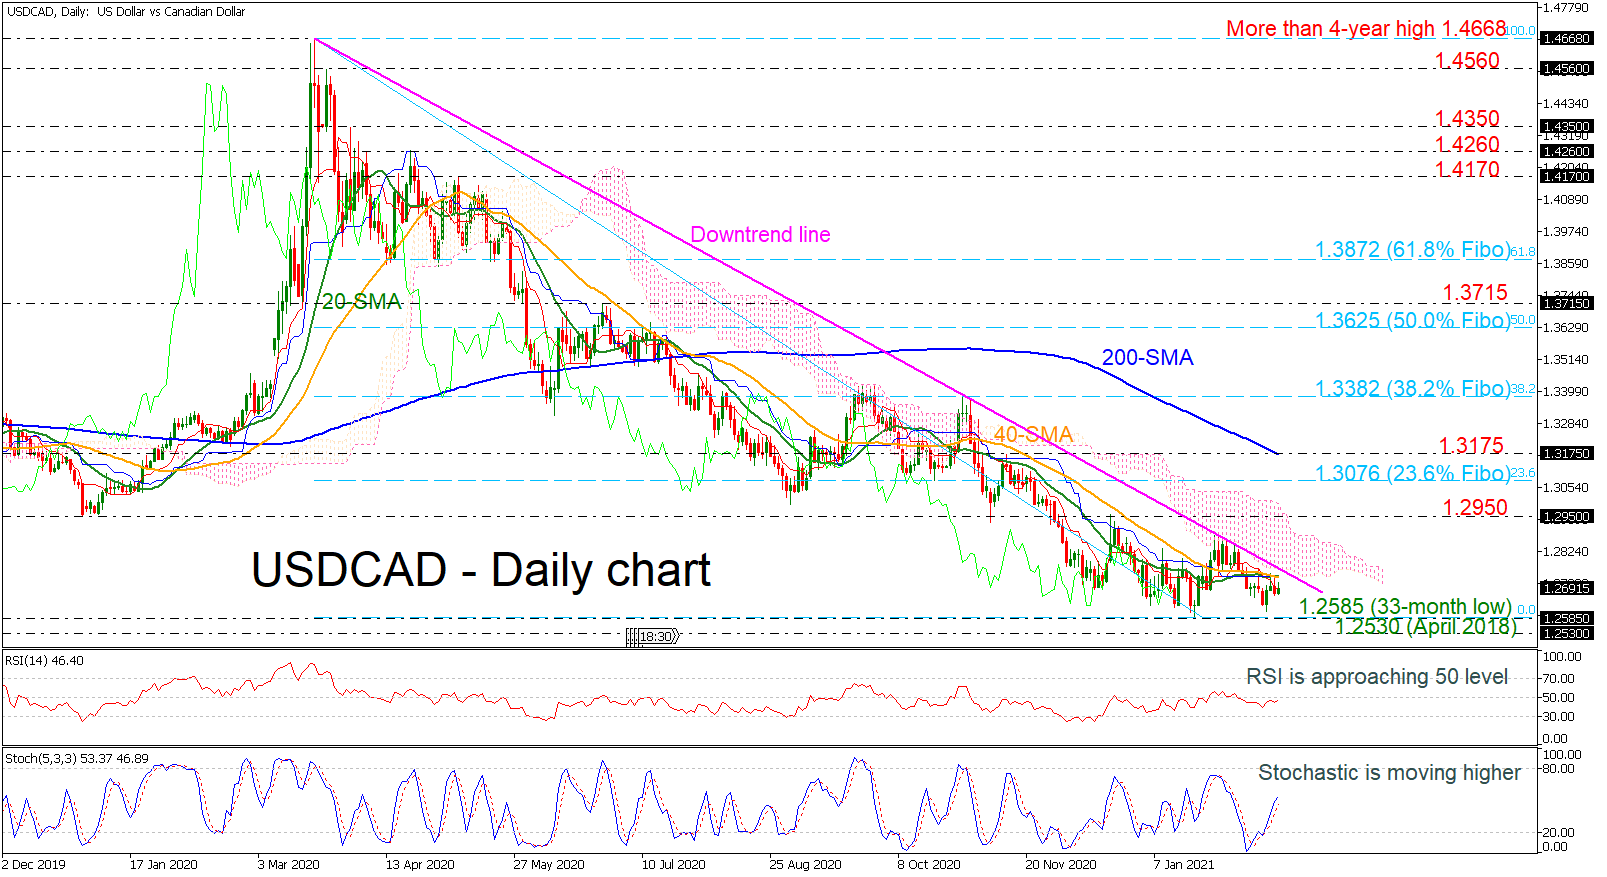
 USDCAD has reversed after the pullback off the long-term descending trend line, dropping below the short-term simple moving averages (SMAs). Negative sentiment appears revived; however, the technical indicators reflect contradicting signals. The RSI, in the negative area, is approaching the 50 level, while the stochastic oscillator is heading north after the bullish crossover within its %K and %D lines.
If buying interest picks up and surpasses the strong bearish trend line, early tough resistance could occur at the 1.2950 high, where the cloud also resides. A violation of this level may shoot the pair to challenge the 23.6% Fibonacci retracement level of the down leg from 1.4668 to 1.2585 at 1.3076. If advances endure these obstacles, buyers may then target the 1.3175 level, which overlaps with the 200-day SMA.
Otherwise, if sellers sink deeper, the 33-month low of 1.2585 could provide the initial key constrictions ahead of the 1.2530 support, taken from the low in April 2018. Steeper declines under the line would have to tackle a more durable support section at 1.2250, identified in January 2018.
Overall, the very near-term picture remains negative below the falling line and the Ichimoku cloud, while a break above the 200-day SMA would cement positive worries.
Origin: XM