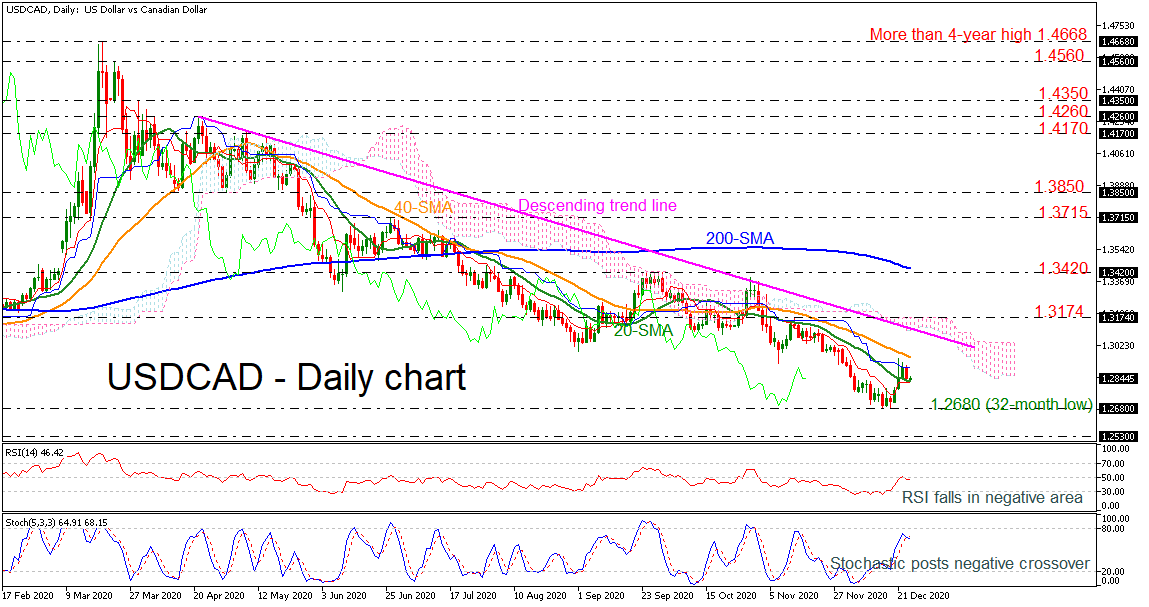
 USDCAD has been consolidating losses since the day it plunged from the more than four-year high of 1.4668. Currently, in the very-short-term, the price is hovering above the 32-month low of 1.2680 and is flirting with the 20-day simple moving average (SMA).
The momentum indicators are suggesting that the sell-off may continue. The RSI is pointing down in the negative territory, while the stochastic posted a bearish crossover within its %K and %D lines. Additionally, in the Ichimoku indicator, the red Tenkan-sen line is flattening below the blue Kijun-sen line.
A decline below the 20-day SMA could take the pair towards the 32-month low of 1.2680 ahead of the 1.2530 level, taken from the trough in April 2018. Lower still, the 1.2250 barrier could react as support, registered in January 2018.
In the event of an upside pullback, immediate resistance could come from the 40-day SMA at 1.2953. The bulls may push harder to clear this line and test the descending trend line around 1.3050, which stands near the Ichimoku cloud. A penetration of the line could take traders to have a look at the 1.3174 resistance ahead of the 200-day SMA around 1.3420.
Meanwhile, in the medium-term picture, the outlook remains strongly bearish following the last months’ free fall. Traders are awaiting a rally above the 200-day SMA to alleviate the down-trending market.

Origin: XM


