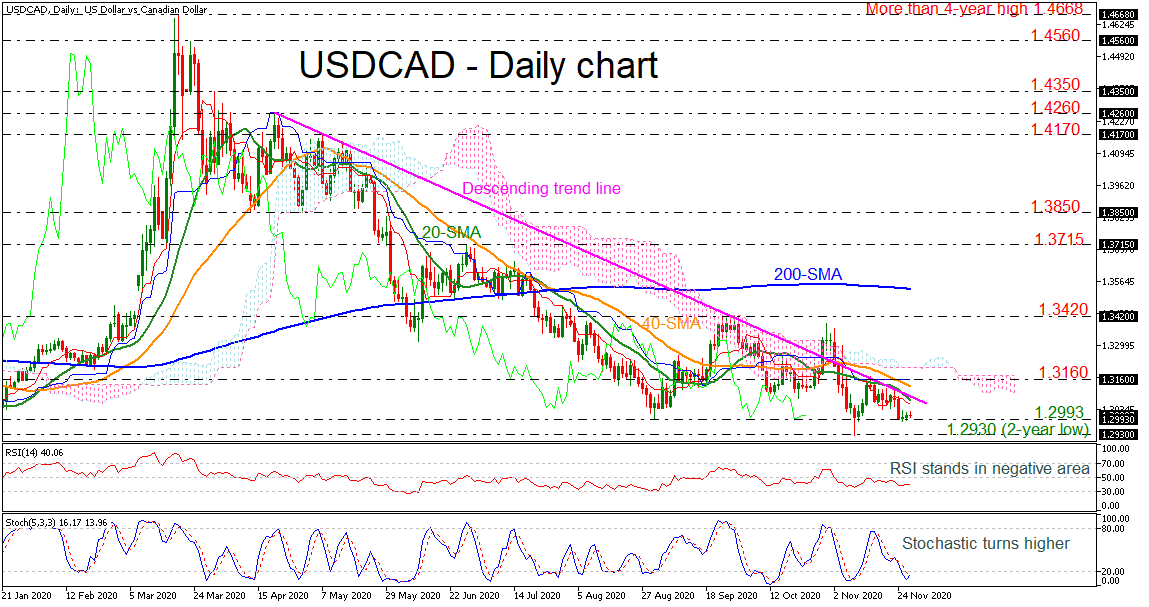
USDCAD has found significant support at the 1.2993 barrier over the last three months, posting a negative spike around 1.2930, which is a new two-year low on November 9. The RSI indicator is still moving sideways in the negative territory, while the stochastic oscillator is turning higher, ready to complete a bullish crossover within its %K and %D lines in the oversold zone.
The price has been remaining in a descending tendency since April 21 and the next support would come from the two-year low of 1.2930 before turning the attention to 1.2780, registered in September 2018. More losses could open the door for the April 2018 low at 1.2530.
Alternatively, an attempt above the falling trend line could meet the 1.3160 resistance, which stands slightly above the 40-day simple moving average (SMA). Breaching these levels, the 1.3420 barrier could halt bullish movements ahead of the 200-day SMA at 1.3533.
Overall, USDCAD is still in a negative direction in both the long- and short-term. Only a jump above the 200-day SMA could switch the bias to neutral.
Origin: XM