


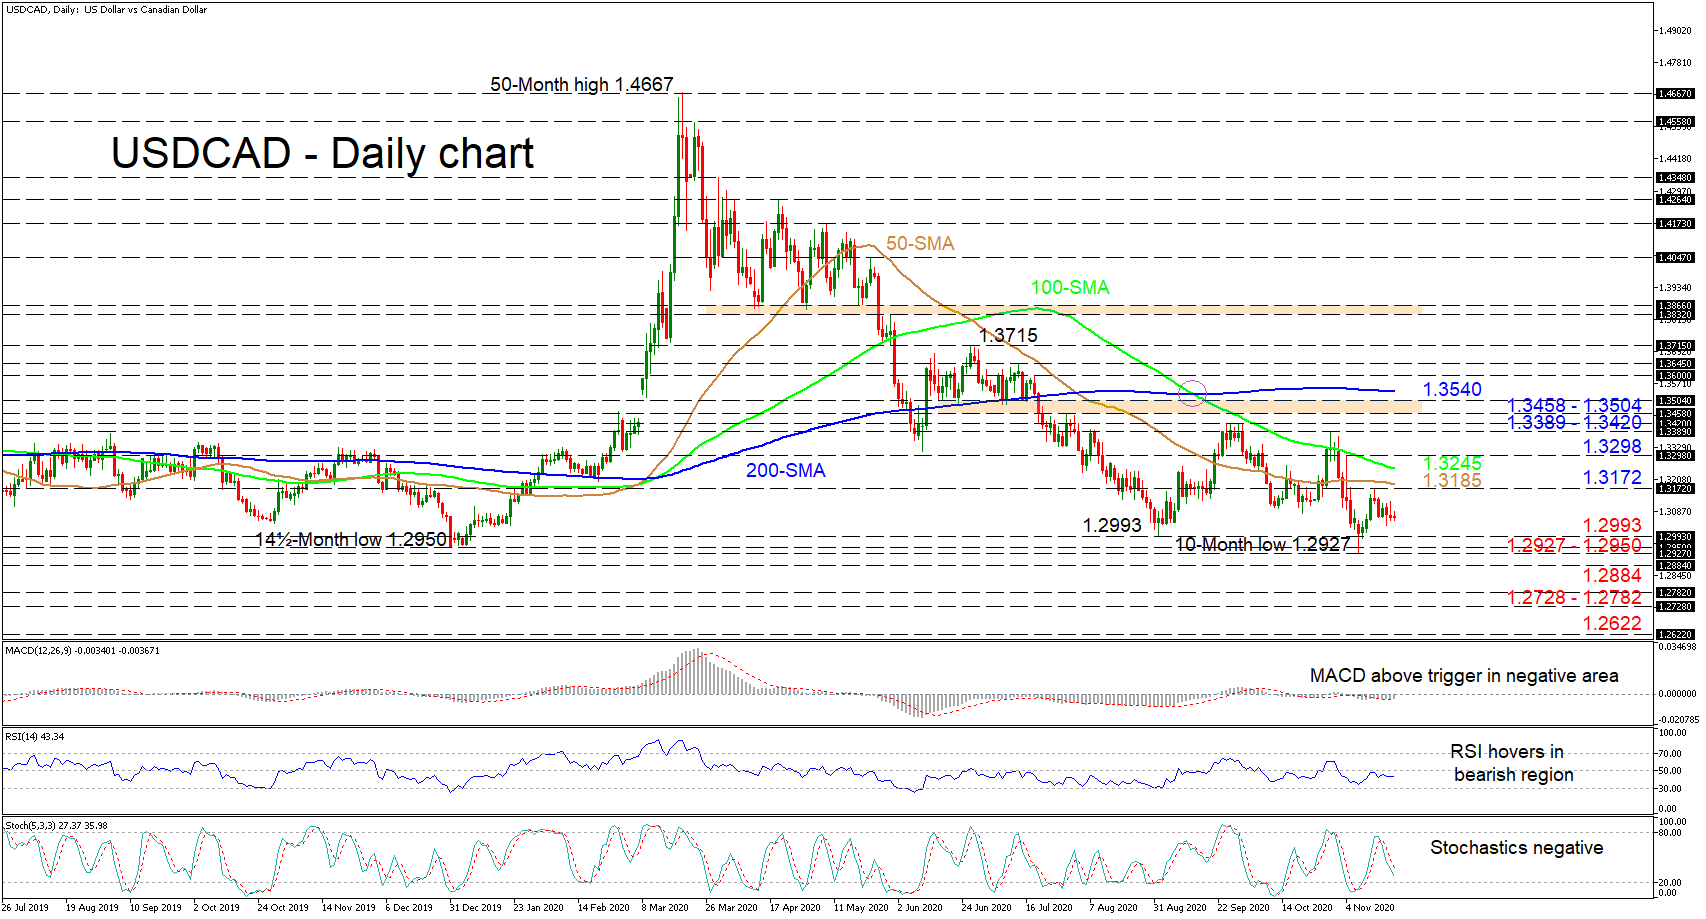
 USDCAD’s dictating bearish picture seems to be taking a breather after a bounce off a newly formed 10-month low of 1.2927. The slowing bearish pace of the 50- and 100-day simple moving averages (SMAs) and the flattening out in the 50-day SMA are assisting the stalled, negatively-skewed structure.
The short-term oscillators currently display conflicting signals in directional momentum. The MACD, in the negative region, is above its red trigger line, while the stochastic oscillator maintains a negative bearing. That said, the flat RSI is hovering slightly below its 50 threshold.
In a positive scenario, early resistance may develop from the 1.3172 high and the nearby 50-day SMA at 1.3185, followed by the 100-day SMA at 1.3245. Should buyers persist to oppose the predominant negative bearing, they may meet constraints from the 1.3298 level before the critical region of highs of 1.3389-1.3420. Moving higher, their efforts may then be challenged by the resistance zone of 1.3458-1.3504, and the 200-day SMA of 1.3540 overhead.
If selling interest intensifies, initial friction to downside moves may come from the key limiting low of 1.2993, followed by the support section of 1.2927-1.2950. Deteriorating under this base, the price may dip towards the 1.2884 obstacle from back in September 2018. Steeper declines may then have sellers meet the 1.2782 trough from October 2018 ahead of the 1.2728 low achieved in May of 2018. If the bears persist, they could take the price as low as the 1.2622 boundary.
Summarizing, a controlling neutral-to-bearish bias has gripped the pair below the SMAs. A break below 1.2927 may strengthen the negative structure, while a thrust above 1.3420 could boost confidence in the pair.
Origin: XM


