


 AUDUSD seems to be range bound, something also reflected in the flattening out of the slopes of the 20- and 40-day simple moving averages (SMAs), though, the price climbed above 0.7250 in the previous daily sessions. The directionless Ichimoku lines and the steadied cloud further reflect this view.
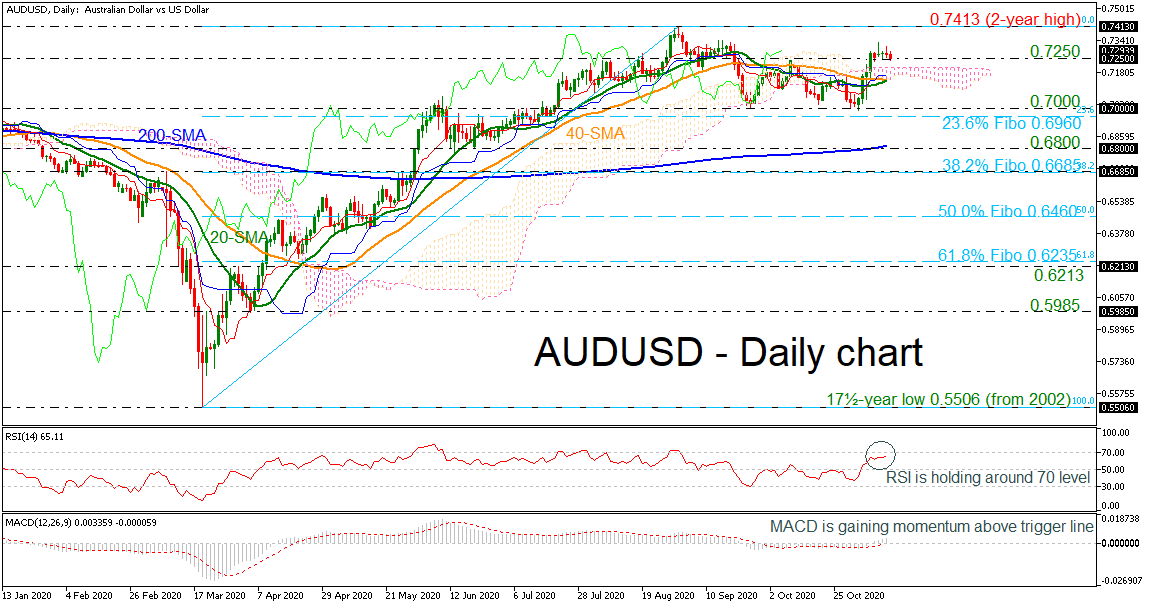
That said, the short-term oscillators, although somewhat stalled, still lean towards a slightly positive picture. The MACD, in the positive region, is holding above its trigger line, while the RSI hovers in bullish territory.
If buying interest intensifies, resistance may originate from the two-year high of 0.7413, taken from the high on September 1. Overcoming this boundary, the price may jump for the 0.7650 resistance, identified in June 2018.
If negative pressures emerge, initial tough support could develop from the zone of the cloud where the 20- and 40-day SMAs of 0.7150 reside. Pushing under the neutral cloud, the 0.7000 psychological number may prevent the decline from reaching the 23.6% Fibonacci retracement level of the up leg from 0.5506 to 0.7413 at 0.6960. Diving beneath this too, the 0.6800 obstacle – coupled with the 200-day SMA – may also attempt to halt further loss of ground towards the 38.2% Fibonacci of 0.6685.
In brief, the very short-term bias is neutral-to-bullish above the SMAs and the cloud. A break either above 0.7413 or below 0.6800 could reveal the next direction.
Origin: XM


