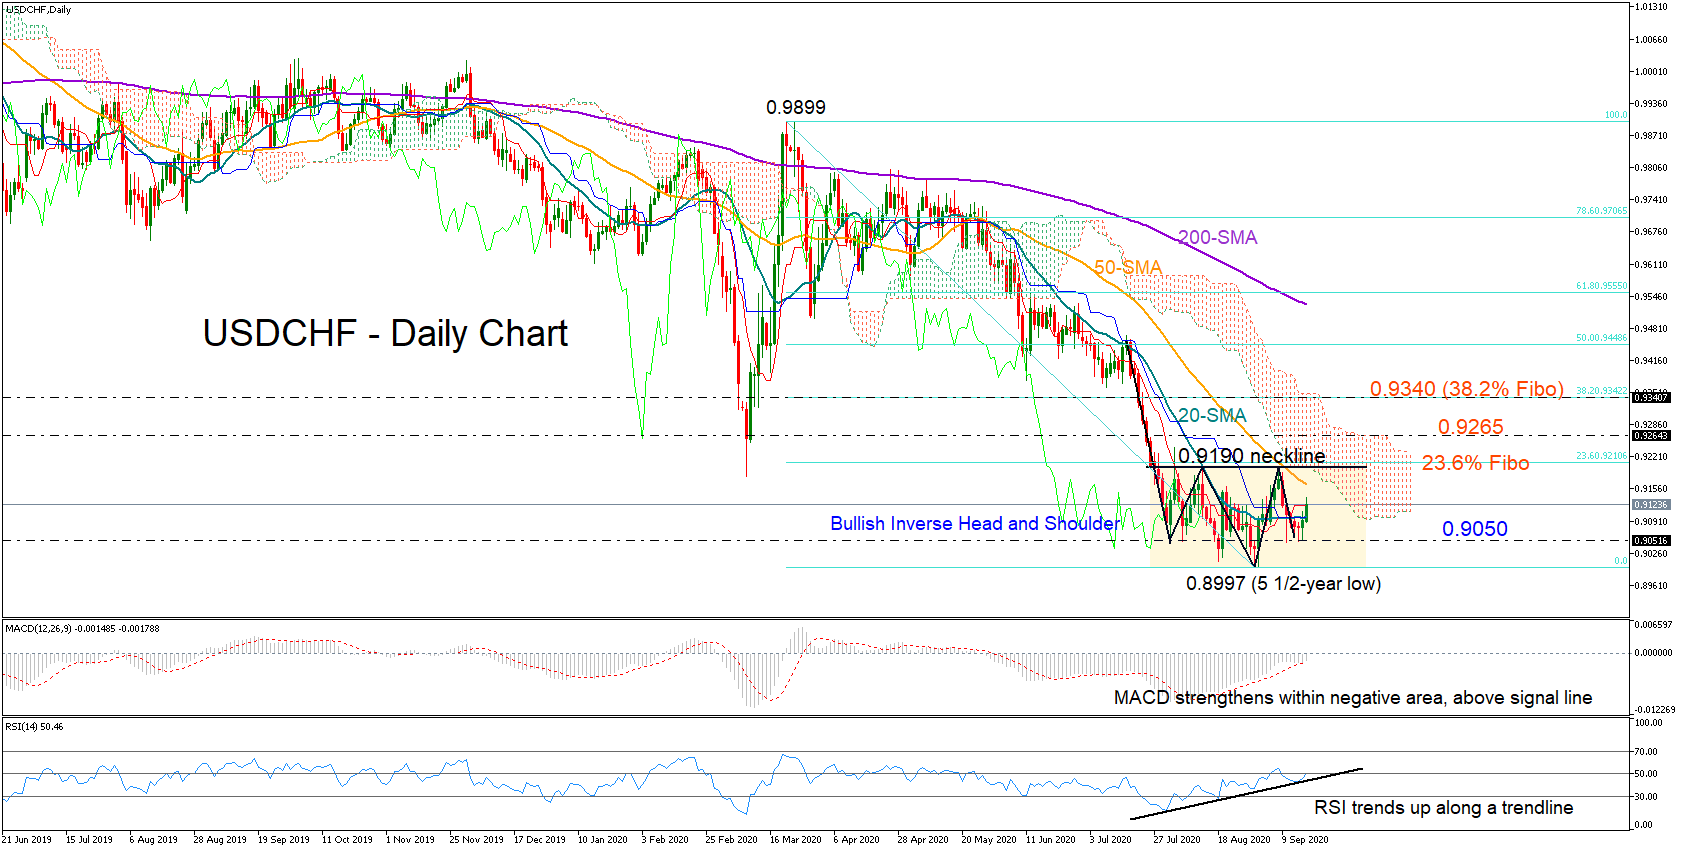
 USDCHF’s sell-off seems to have found a bottom around its 5 ½-year low as the five-week old range looks to have transformed to an inverse head and shoulder pattern – a bullish signal that the price may change direction to the upside.
However, this is not the only encouraging sign. In momentum indicators, the RSI has been printing higher highs and higher lows along an ascending trendline and is currently ready to cross back above its 50 neutral mark. Likewise, the MACD has been gaining ground within the negative territory and above its red signal line.
Still, the bulls may not fully come forward unless the price confirms the bullish formation by breaking forcefully above the 0.9190 neckline, which is slightly below the 23.6% Fibonacci of the 0.9899-0.8997 downleg. A close above the 50-day simple moving average (SMA) currently at 0.9164 could make this scenario possible. Then, an extension above the 0.9190 level may initially consolidate around the upper band of the Ichimoku cloud near 0.9265 before climbing towards the 38.2% Fibonacci of 0.9342.
In the event of a downside reversal, immediate support may occur around 0.9150. A violation at this point would shift all attention to the 0.8997 bottom, a break of which is expected to continue until 0.8850, making the bearish outlook even worse.
Summarizing, USDCHF is exposed to a bullish trend reversal, though a rally above 0.9190 is required to confirm that and hence shift the bias positive.
Origin: XM