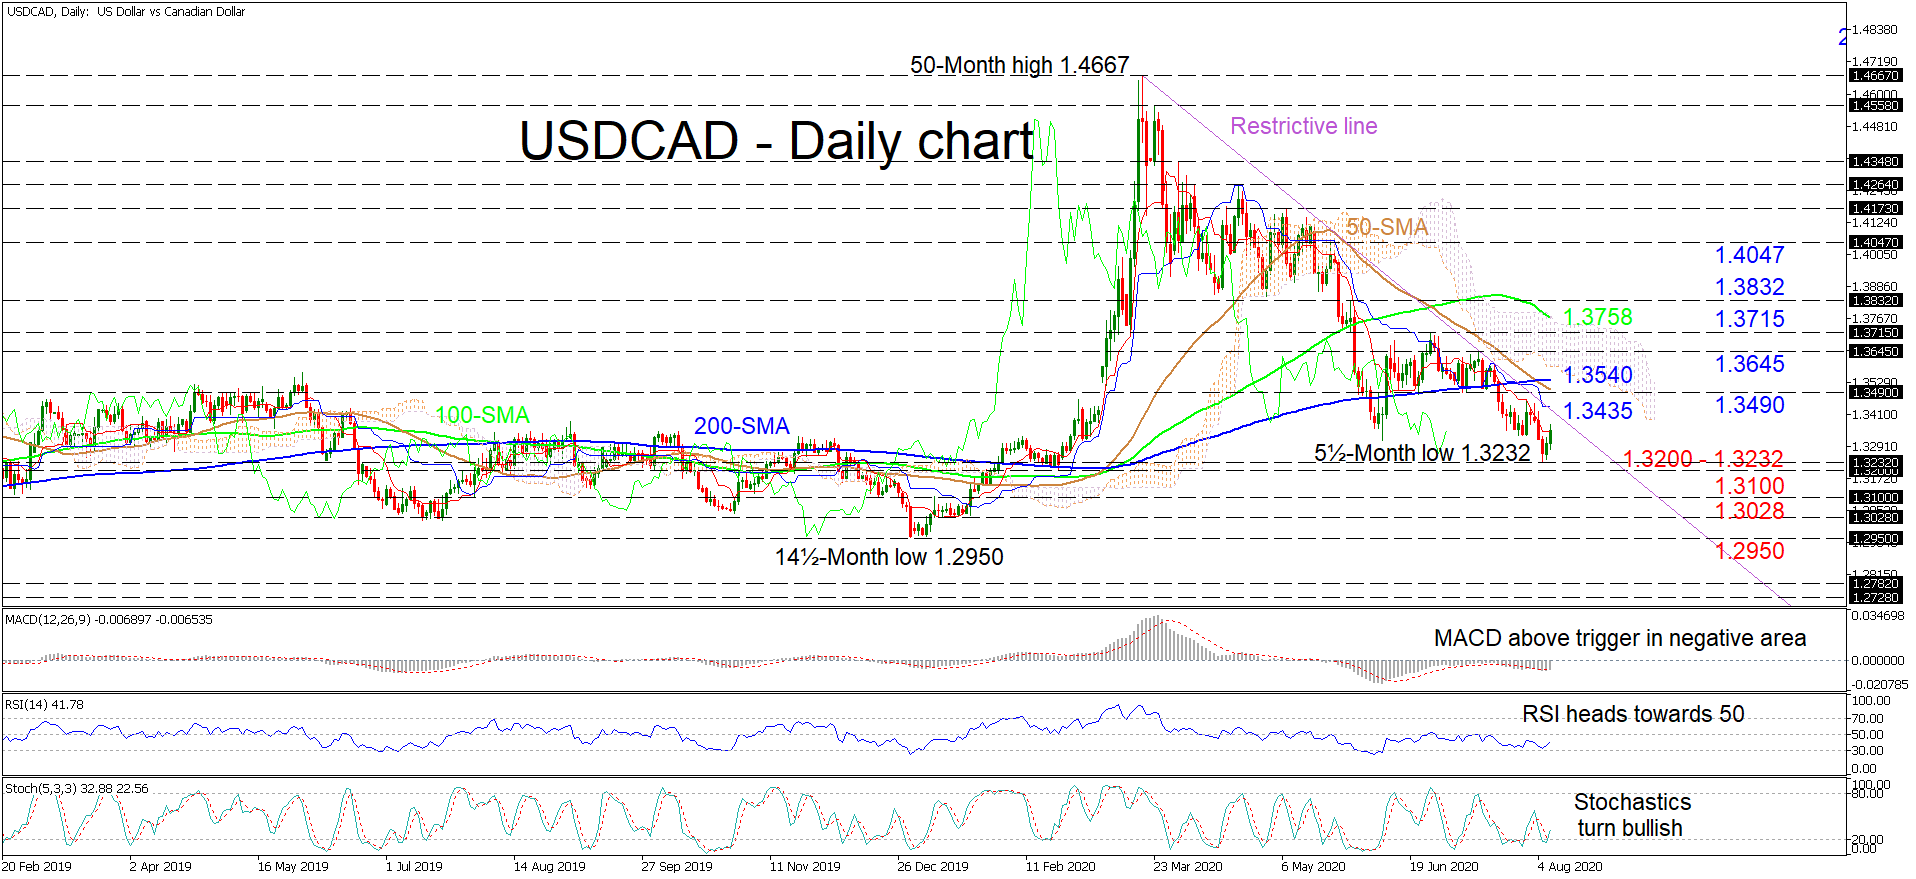
 USDCAD is maintaining its negative course below the restrictive line, although it has found some footing at the 1.3232 level. The negatively charged Ichimoku lines and the recent bearish crossover of the 200-day simple moving average (SMA) by the 50-day one may keep the negative bias in play for a while longer.
That said, the recent improvement in price is reflected in the short-term oscillators, which promote additional advances. The MACD, in the negative region, has moved above its red trigger line, while the RSI heads higher in bearish territory from the 30 mark. Moreover, the stochastics have turned bullish, pushing above the 20 oversold level.
To the upside, initial resistance may occur from the diagonal line and the blue Kijun-sen line around 1.3435. A step above may encounter stronger constraints from the 1.3490 barrier – where the 50-day SMA currently lies – until the 200-day SMA at 1.3540 overhead. Overtaking this zone, the price may challenge the 1.3645 and 1.3715 highs ahead of the 100-day SMA, currently at 1.3758. Sustained gains above the cloud may then target the 1.3832 barrier and the 1.4047 peak.
If sellers resurface, initial key support may arise from the 1.3200 to 1.3232 section, which if broken could plunge the pair towards the 1.3100 obstacle. Further loss of ground could reel in the 1.3028 trough and the 14½-month low of 1.2950.
Summarizing, should USDCAD maintain a negative bearing below the SMAs and the descending line, the short-to-medium-term timeframe could see a neutral bias returning, with tendencies for further weakening.
Origin: XM