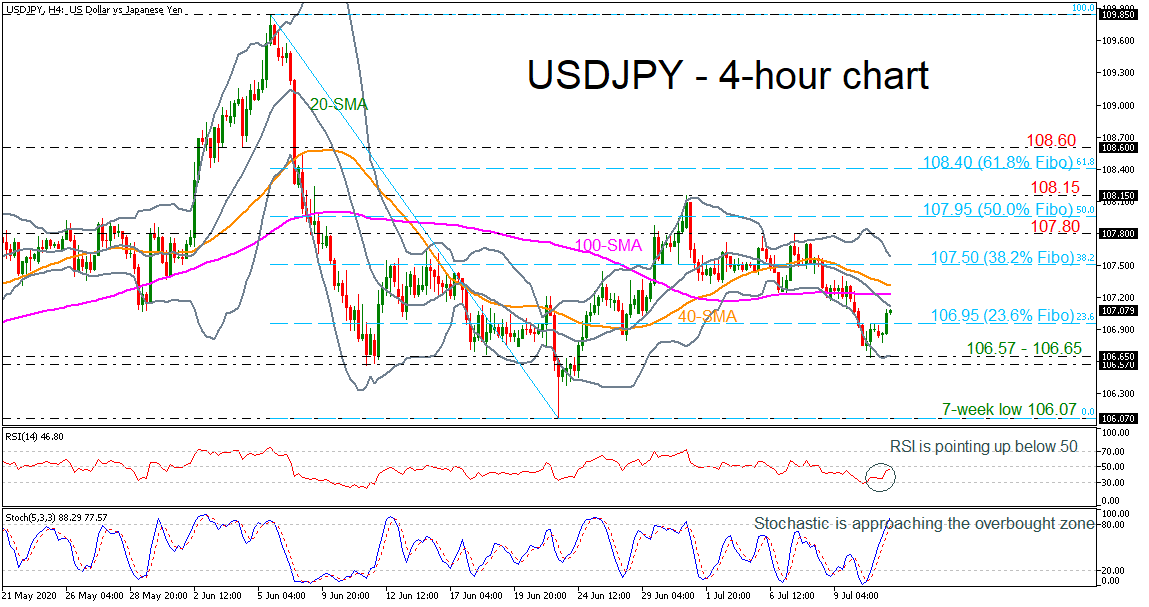
 USDJPY produces an upward attempt above the 23.6% Fibonacci retracement level of the down leg from 109.85 to 106.07 at 106.95, turning the momentum indicators to the upside.
Technically, the stochastic oscillator is heading north in the overbought zone, while the RSI is pointing higher in the negative territory. However, the moving averages are sloping down with the mid-level of the Bollinger band creating a negative cross with the 100-period simple moving average (SMA) in the very short-term.
More upside pressure could hit the moving averages around 107.10 – 107.30 before meeting the 38.2% Fibonacci of 107.50, which stands near the upper Bollinger band. Moving higher, the 107.80 barrier could be a significant level for traders ahead of the 107.95 resistance, being the 50.0% Fibo and the 108.15 hurdle.
On the flip side, a retreat below the 23.6% Fibo of 106.95 could open the way for the lower Bollinger band and the 106.57 – 106.65 support zone. A successful fall below this region could meet the 106.07 obstacle, identified by the low on June 23.
Concluding, the profile retains the neutral outlook in the short- and medium-term timeframes.
Origin: XM