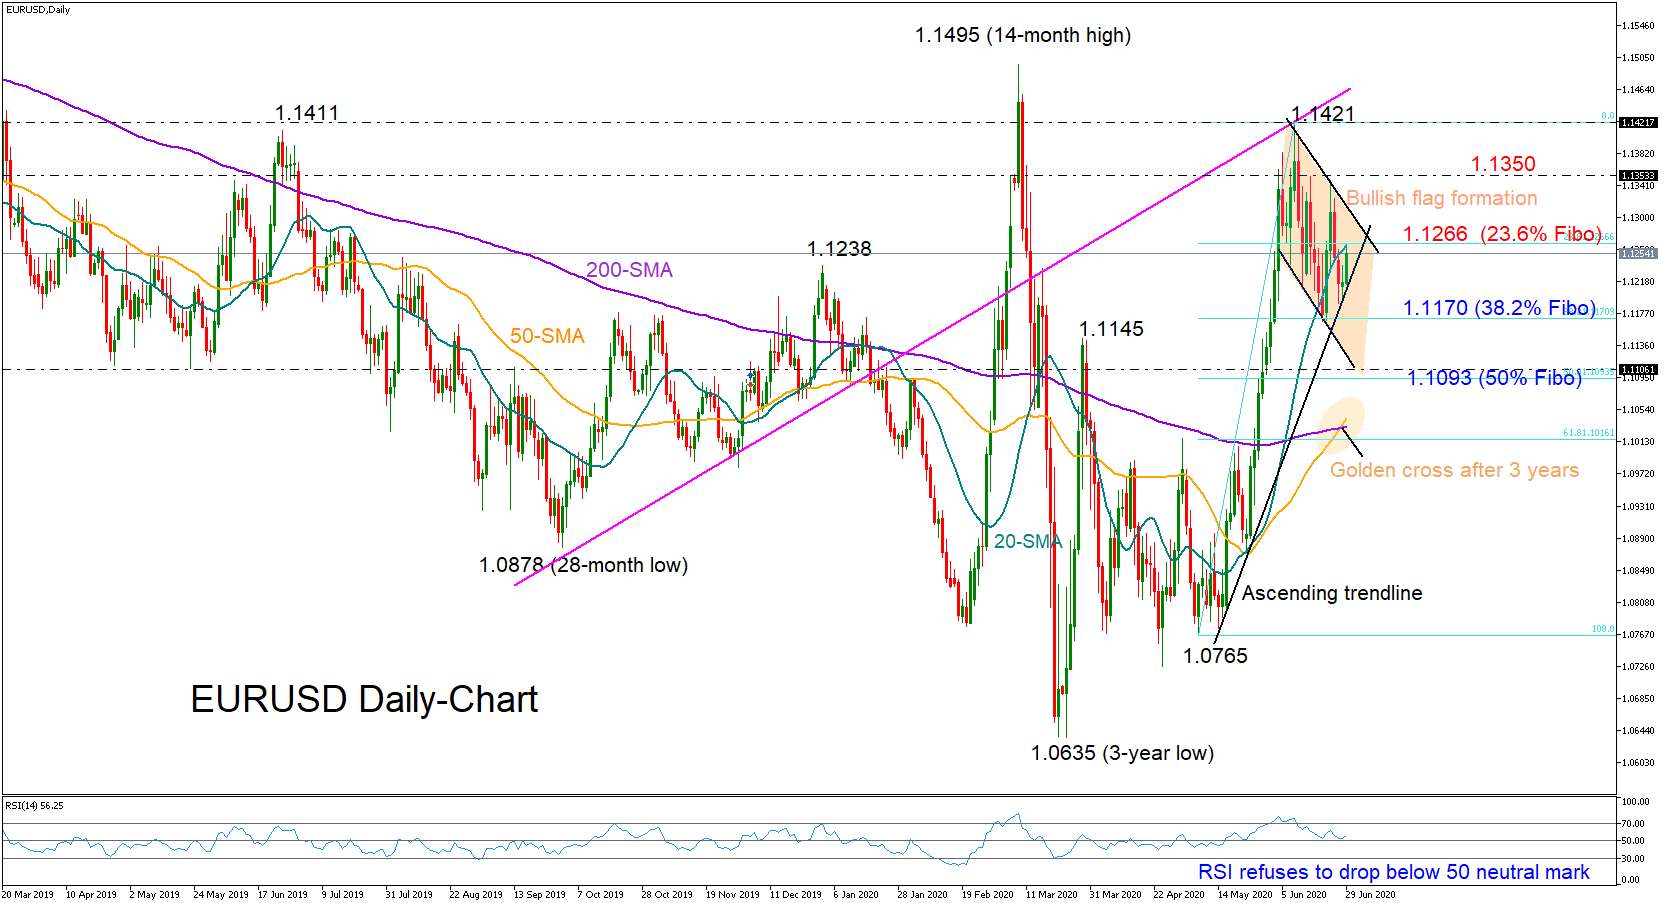
 EURUSD seems to be trading within a downward-sloping channel on the daily chart which seems to be part of a bullish flag formation created after the steep rally to 1.1421.
The pattern is a positive signal that the downside correction in the price is temporary and the market could soon resume its upward direction once the bulls smash the upper surface of the channel. The fact that the 50- and 200-day simple moving averages have (SMAs) have positively crossed each other after three years is indicating greater optimism that buyers may dominate. Meanwhile, in momentum indicators, the RSI could be another encouraging sign if it manages to hold above its 50 neutral mark.
Following today’s bounce on the ascending trendline that has been holding since mid-May, a close above the 23.6% Fibonacci retracement level of the 1.0765-1.1421 up leg, at 1.1266, is required to drive the price towards the channel’s ceiling seen around 1.1300. Note that the 20-day SMA happens to be in the same location. In case buying pressure violates the flag, the door would open for the 1.1350 resistance region and then for the 1.1421 peak.
In the negative scenario where the pair dives below the ascending trendline, the 38.2% Fibonacci of 1.1170 could come to the rescue, blocking the way towards the bottom of the channel and the 50% Fibonacci of 1.1093.
In brief, EURUSD is still in a downward move in the very short-term picture but the creation of a bullish flag hints that recent losses could be short-lived. A break above the descending channel could confirm the positive signals.
Origin: XM