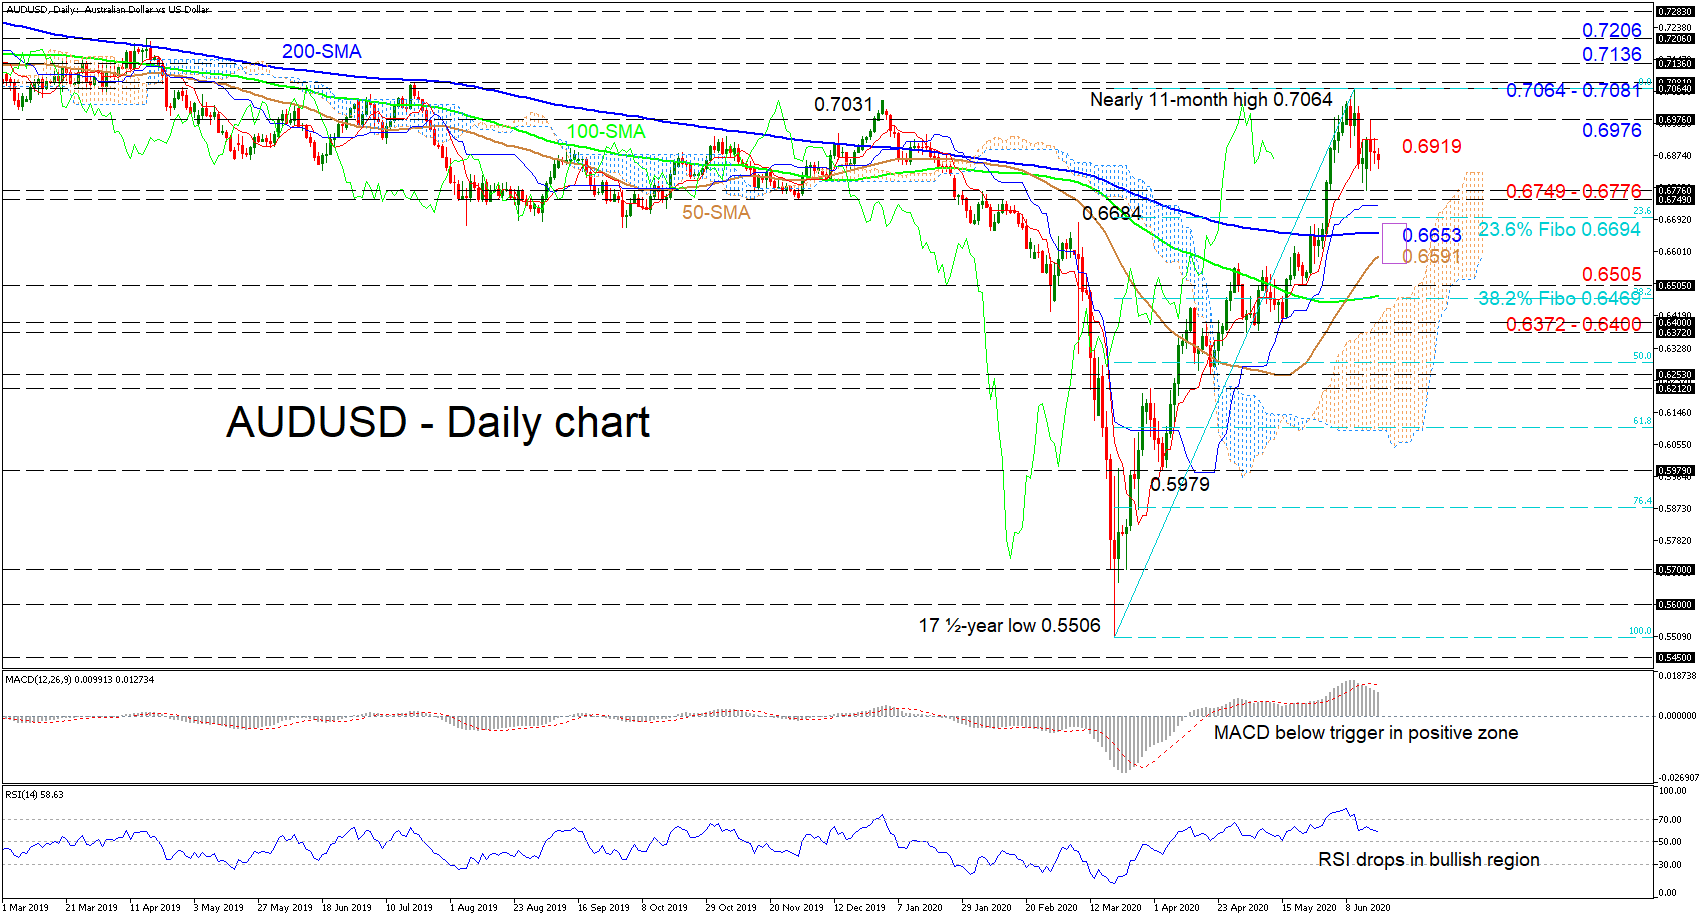
 AUDUSD appears paused after having pivoted from a formed nearly 11-month peak of 0.7064, something also reflected in the flattened Ichimoku lines.
Although the tone of the 50-, 100-day simple moving averages (SMAs) and the Ichimoku lines sponsor an improving picture, the short-term oscillators reflect weakening positive momentum. The MACD, deep in the positive zone, is declining below its red signal line, while the RSI drops in bullish territory.
If sellers maintain control and the support section of 0.6749 – 0.6776 fails to halt downside moves, the crucial 0.6694 mark could step up to the plate, that being the 23.6% Fibonacci retracement of the up leg from 0.5506 to 0.7064. Steeper declines may encounter some friction around the area of the 200-day SMA at 0.6653 until the 50-day SMA at 0.6591, prior to challenging the key 0.6505 trough. A step underneath could then turn the focus to the 38.2% Fibo of 0.6469 coupled with the 100-day SMA.
If positive sentiment picks up, the red Tenkan-sen at 0.6919 and the initial 0.6976 barrier may attempt to deny the revival of the climb ahead of the resistance area from 0.7064 – 0.7081. Should the bulls jump above this crucial border, the pair may gain further ground testing the 0.7136 and 0.7206 obstacles from April and February of 2019.
Summarizing, the short-term bias remains positively charged since the 17½-year low of 0.5506 and a break above 0.7081 could turn the medium-to-long-term outlook bullish. Yet, a close below 0.6372 -0.6400 would spark worries of downside scenarios.
Origin: XM