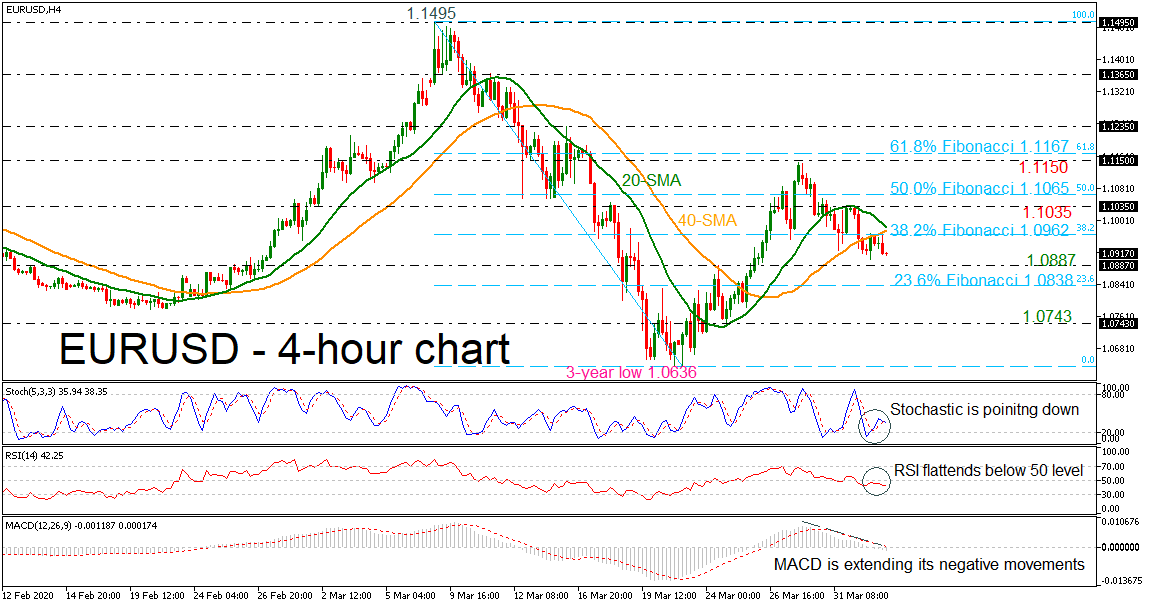
 EURUSD is falling lower again near 1.0900, below the 20- and 40-period simple moving averages (SMAs) and the 38.2% Fibonacci retracement level of the down leg from 1.1495 to 1.0636 at 1.0962 over the last days. The pullback on the confronted 1.1150 level appeared to be a strong resistance for the bulls as the short-term trading is shifting bearish again.
The stochastic oscillator is turning lower again, while the RSI is sliding below the 50 level and the MACD oscillator is extending its negative momentum below the zero line.
Immediate support may come from the 1.0887 support level, taken from the inside swing top on March 24. If traders continue to sell the pair, the market could retest the 23.6% Fibonacci at 1.0838. Steeper declines could send the pair to the 1.0743 minor level before heading towards the three-year trough of 1.0636.
On the other hand, a sharp climb above the 20- and 40-period SMAs, in the 4-hour chart, which are ready for a bearish cross, could take the price to see the 1.1035 resistance level ahead of the 50.0% Fibo of 1.1065. A step above these levels could send the price to 1.1150, taken from the latest highs.
Summarizing, the negative bias looks to be continued in the short-term as the SMAs and the technical indicators are confirming this view.
Origin: XM