


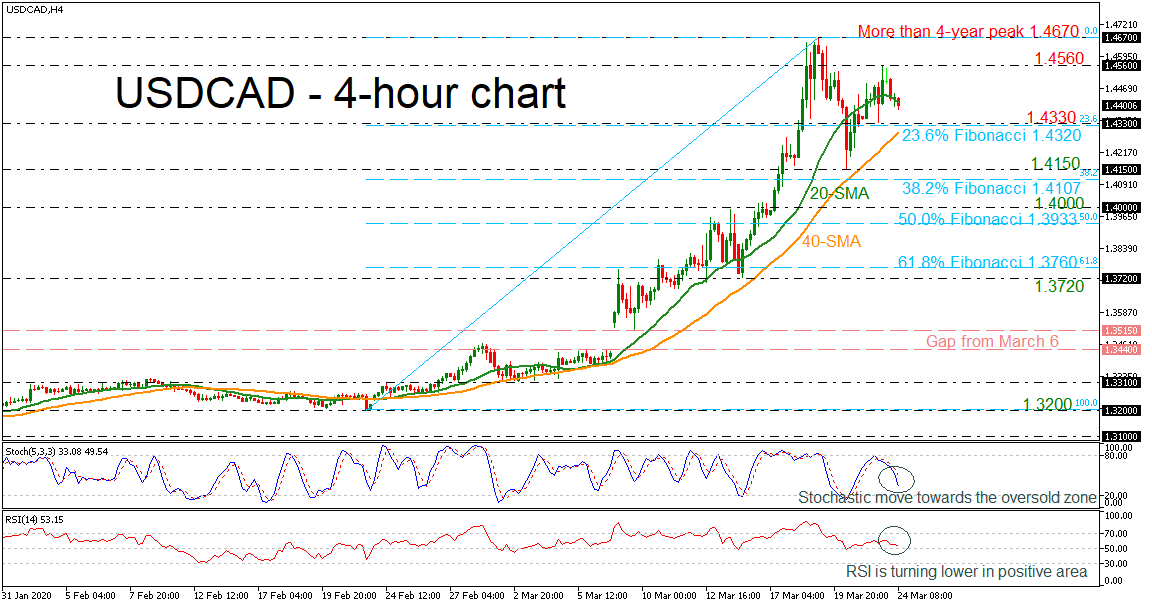
 USDCAD is on course to slip beneath the short-term 20-period simple moving average (SMA) creating a neutral mode after the sell-off from the more than four-year high of 1.4670. According to the momentum indicators, the stochastic oscillator is diving towards the oversold zone, while the RSI is turning lower in the positive area.
Immediate support is being provided by the 23.6% Fibonacci retracement level of the up leg from 1.3200 to 1.4670, around 1.4320, which stands near the 1.4330 support and the 40-period SMA in the 4-hour chart. However, should prices dip lower again, the next support would likely come from the 1.4150 barrier ahead of the 38.2% Fibonacci of 1.4107 and the 1.4000 handle.
In case of an upward attempt, USDCAD would likely meet resistance at the latest high of 1.4560. A break above this hurdle would ease the near-term downside pressure, sending prices until the more than four-year high of 1.4670. Even higher, the inside swing low from 2002 at 1.5035 could come in the spotlight.
In the medium term, the bullish outlook remains intact, as prices surpassed aggressively the 1.3500 psychological mark, creating a bullish gap.
Origin: XM


