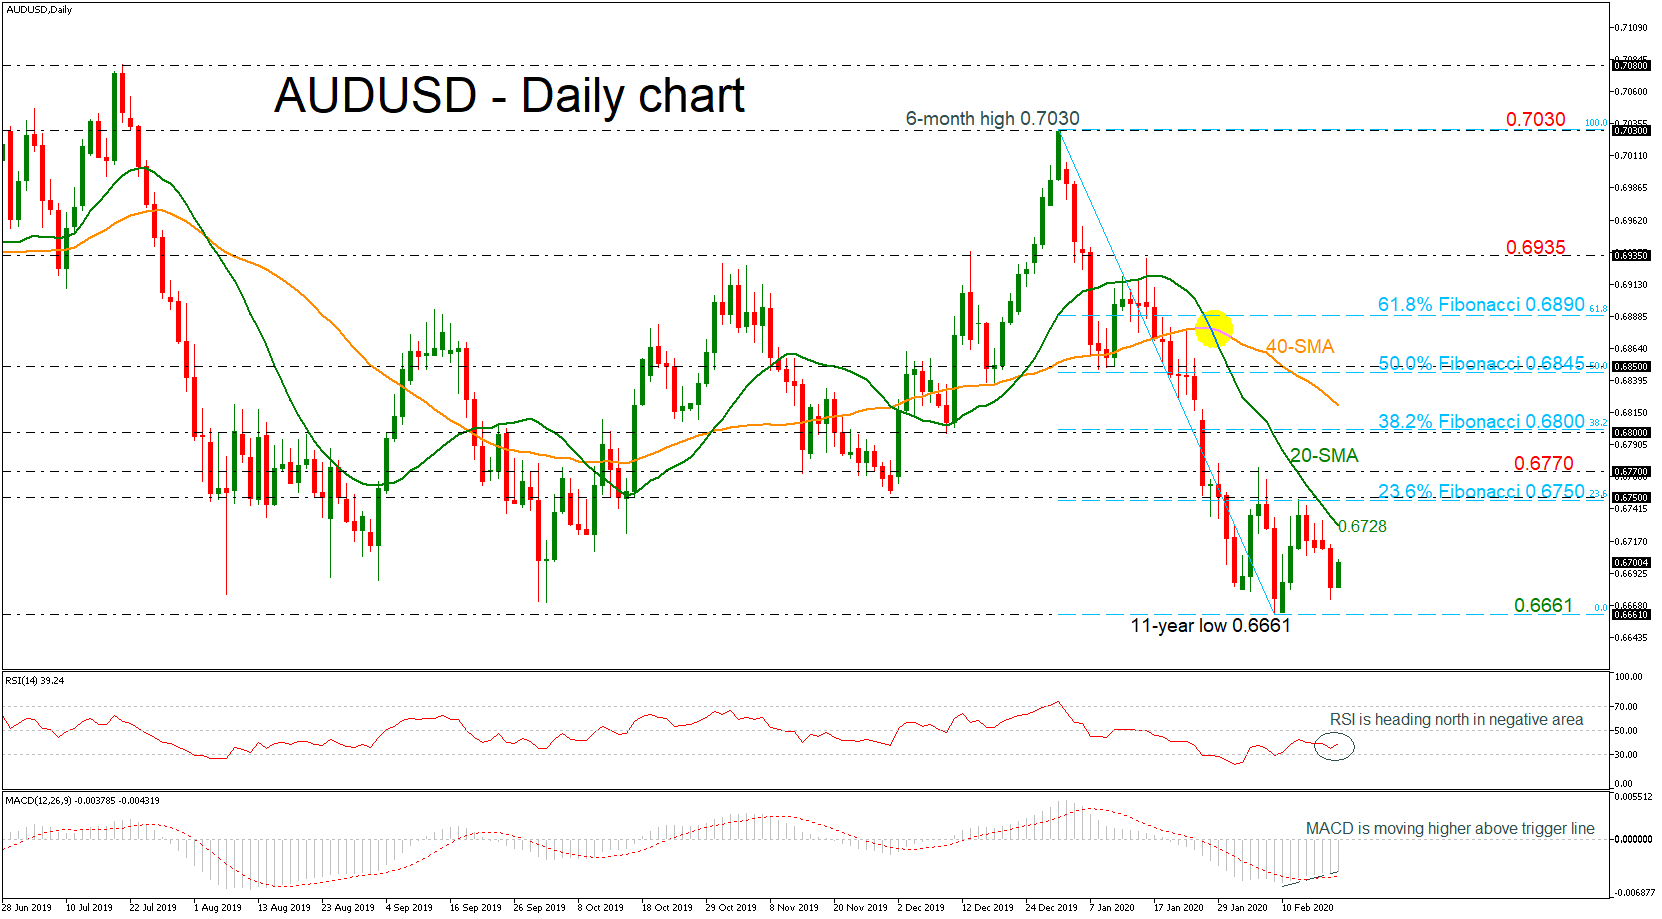
 AUDUSD is moving sideways within the 23.6% Fibonacci retracement level of the downward wave from 0.7030 – 0.6661 near 0.6750 to the eleven-year low of 0.6661. The latest level was reached on February 7 and acted as a reversal mark ahead of three consecutive green days.
Technically, the RSI is in bearish territory below 50 but is clearly pointing up, while the MACD is gaining some ground above the trigger line in the negative area. Moreover, the 20- and 40- simple moving averages (SMAs) are continuing the downward move after the bearish cross on January 28.
Immediate resistance to gains would likely come from the 20-day SMA currently at 0.6728. If there is a successful break above this area, further resistance could be met at the 23.6% Fibo of 0.6750 before flirting with the 0.6770 barrier. Higher up, the 38.2% Fibonacci of 0.6800 could be a critical level to watch.
If, however, the selling interest continues, support would initially come from the eleven-year low of 0.6661. An aggressive decline could send prices to the next psychological levels of 0.6600 and 0.6500. Further down, the 0.6355 low from 2003 could be a key barrier for traders.
Overall, in the medium-term picture, the bearish outlook remains intact as the price is creating a downtrend below the six-month high of 0.7030.
Origin: XM