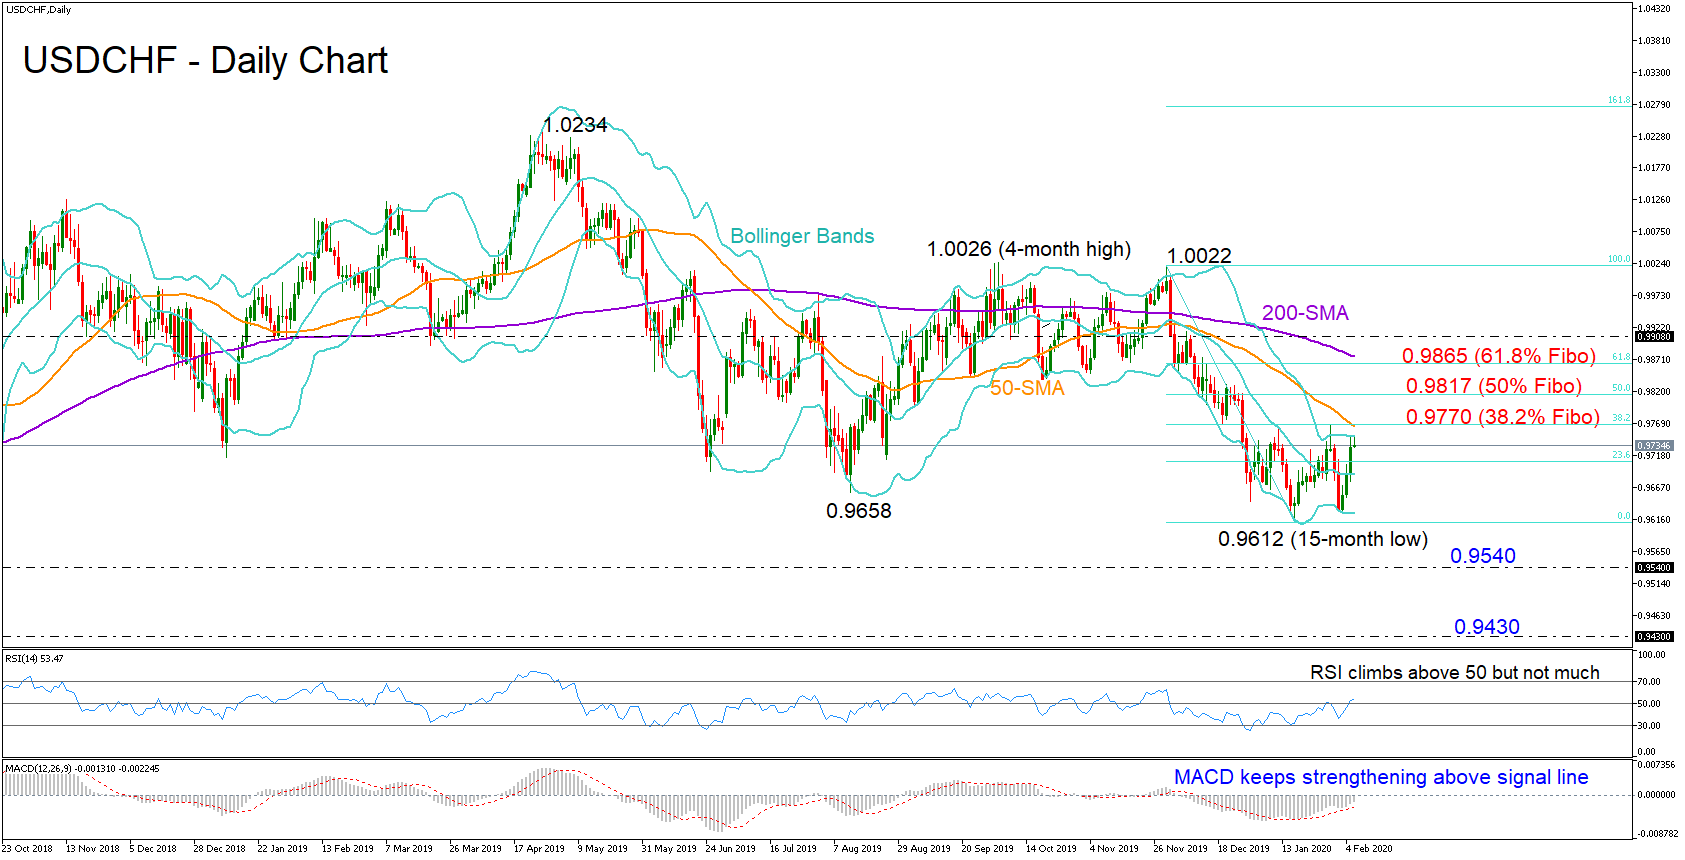
 USDCHF started the month on the right foot, with the price refusing to revisit the 15-month low of 0.9612 and instead rebounding back to the 0.9700 region this week.
While bullish pressure seems to be gathering as the RSI is pushing efforts to expand above its 50 neutral mark and the MACD is increasing positive momentum above its red signal line, it remains to be seen whether the price can remain around the upper Bollinger band and more importantly surpass the 38.2% Fibonacci of the 1.0022-0.9612 downleg which recently acted as strong resistance.
Any successful close above the 38.2% Fibonacci of 0.9770, where the 50-day simple moving average (SMA) currently lies, could add more legs to the rally, bringing the 50% Fibonacci area of 0.9817 next into focus. Slightly higher, the 61.8% Fibonacci of 0.9865 and the 200-day SMA may also reject any further improvement. Yet, for medium-term buyers, a run above 1.0022 would be more preferable.
In the negative scenario, the nearest key support area for a downside extension below the 0.9612 bottom is the September 2018 trough of 0.9540, while beneath that, another important barrier could be the 0.9430 level which managed to reject bearish actions several times in the past.
Summarizing, the short-term bias seems to be turning positive, though only a rally above 0.9770 could confirm that. In the medium-term picture, a sharper rise above 1.0022 is required to resume bullish appetite.
Origin: XM