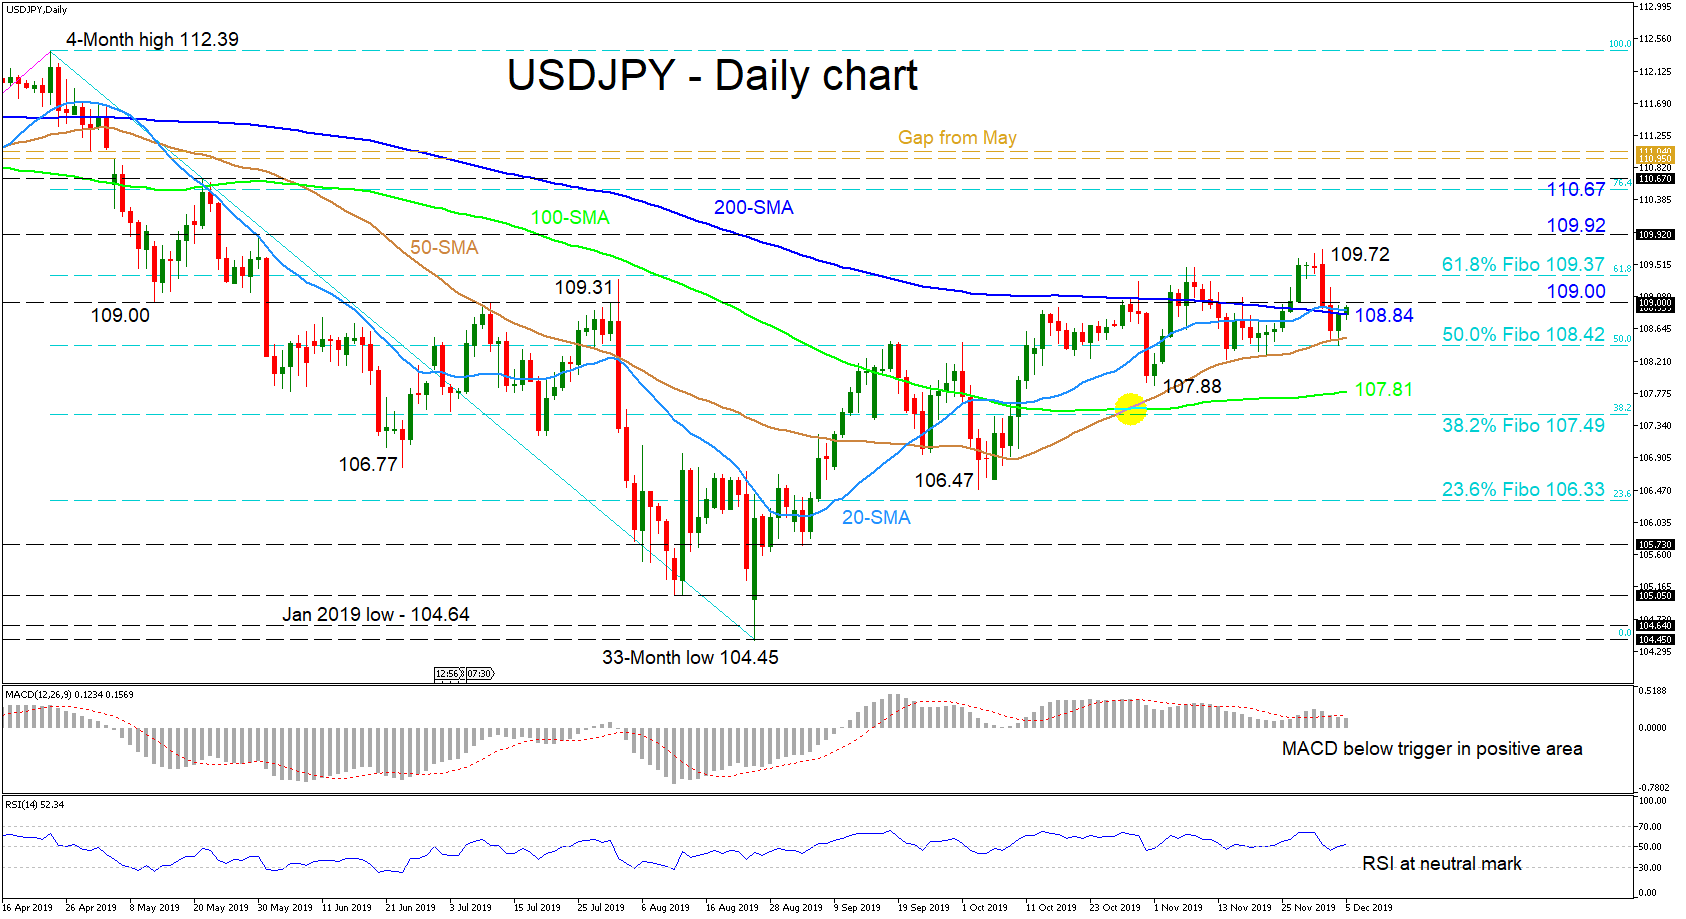
 USDJPY despite the recent fading in the pair, continues to find support from the 50-day simple moving average (SMA) and the 108.42 level, which is the 50.0% Fibonacci retracement of the down leg from 112.39 to 104.45. The intact positive picture looks to be easing into a more sideways outlook, something also backed by the convergence within the SMAs.
The short-term oscillators reflect a stalling in directional momentum with the RSI flat at the 50 level, while the MACD, in the positive region, has slipped below its red trigger line.
If buyers manage to push above the immediate obstacle of 109.00, the nearby 61.8% Fibo of 109.37 and fresh high of 109.72 could then cease the pair gaining further ground. Next, the neighboring 109.92 swing high from May 30 could interrupt the climb to test the 110.67 resistance level from May 21 and the gap of 110.95 to 111.04 slightly above, coming from the beginning of May.
Otherwise, if sellers mange to drive the price back down past the 200-day SMA and the 108.42 area – where the 50.0% Fibo and 50-day SMA reside – upside pressure could come from the 107.81 region, where the 100-day SMA and lower low lie. If selling persists, the 38.2% Fibo of 107.49 could challenge the bears ahead of the 106.47 trough and nearby 23.6% Fibo of 106.33.
Overall, the short-term bias looks neutral-to-bullish and a break above 109.92 would strengthen that outlook. However, a drop past the recent swing low of 107.88 could see a negative picture unravel.
Origin: XM