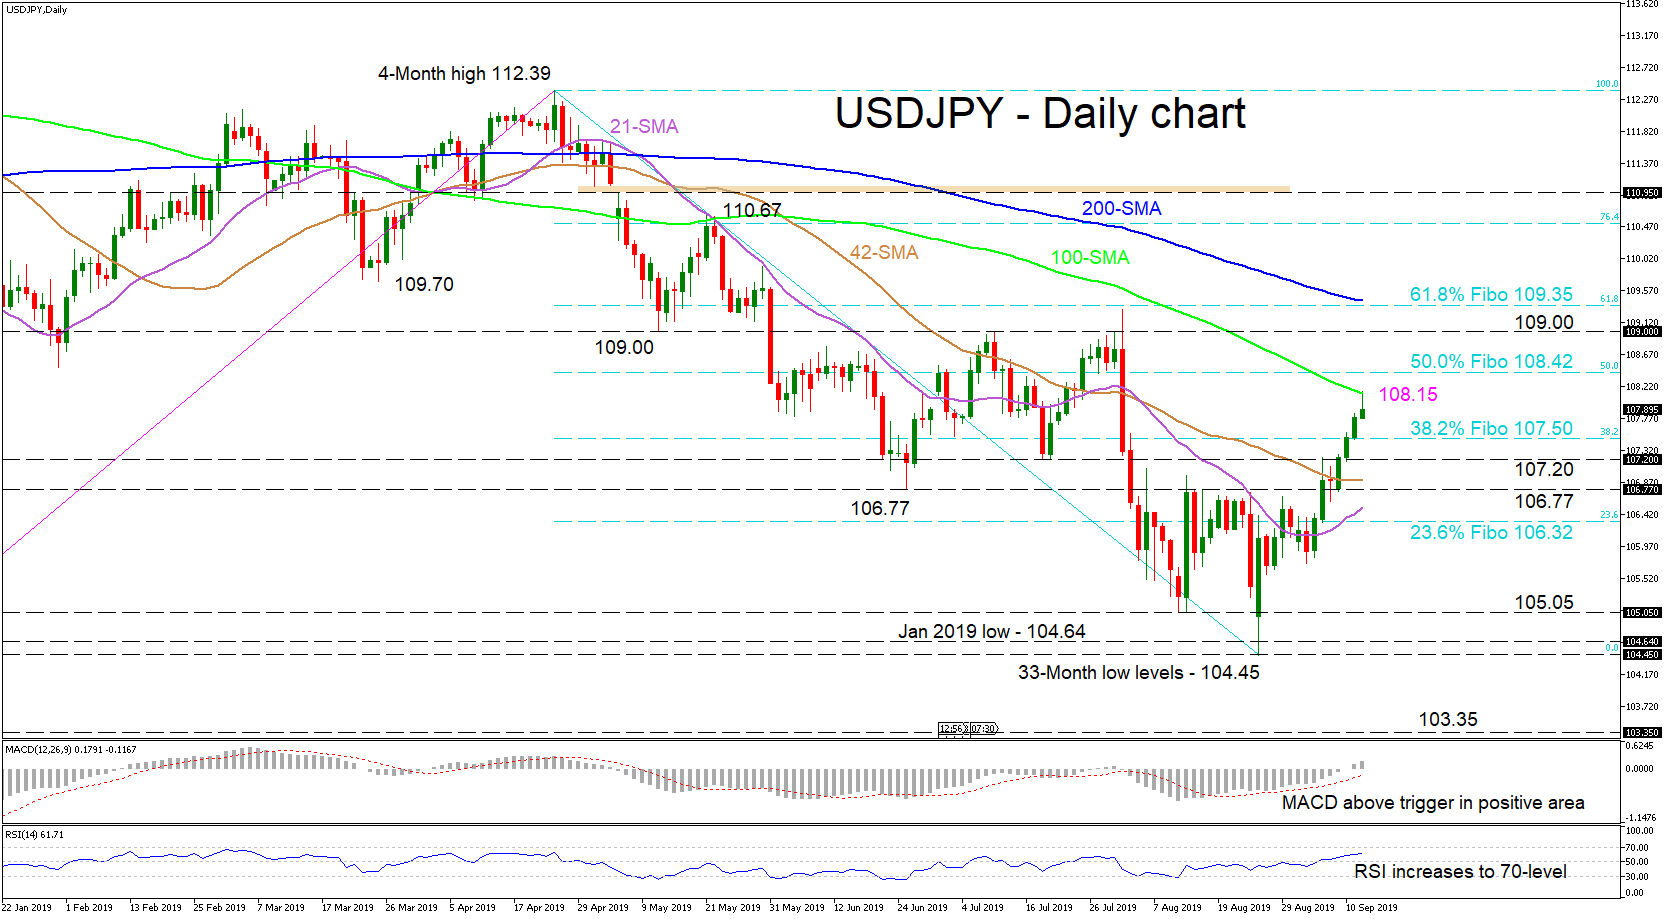
 USDJPY rallied through the 21- and 42-day simple moving averages (SMAs), as well as the 107.50 resistance, which is the 38.2% Fibonacci retracement level of the down move from 112.39 to 104.45. The move up started on September 3, ending a three-week consolidation period and propelling the price up to the 100-day SMA.
In an attempt to make more gains, the bulls are accompanied by signals of increasing positive momentum, as the MACD has distanced itself from its red trigger line and has ascended into the positive region. The RSI is experiencing a steady incline towards the overbought area. Noteworthy is the reversal in the 21-day SMA for a bullish cross of the 42-day SMA, which is starting to flatten.
If the bulls manage to move over the 100-day SMA, this could resurrect the move up, initially testing the 50.0% Fibo of 108.42. Breaching higher and overcoming the 109 handle, this could draw traders’ focus to a more important resistance, at 109.35 where the 61.8% Fibo and the 200-day SMA also lie. Even higher, the 110.67 peak could unfold.
If the bears take control of the helm, they could steer the price to the initial support of 107.50, which is the 38.2% Fibo. Pushing lower through the congested area of supports from 107.20 to 106.77, the 21-day SMA could apply some friction before the 23.6% Fibo of 106.32.
Overall, the short-term bias is bullish. A close above 109.00 could turn the bias neutral, but above 110.00 would confirm it.
Origin: XM