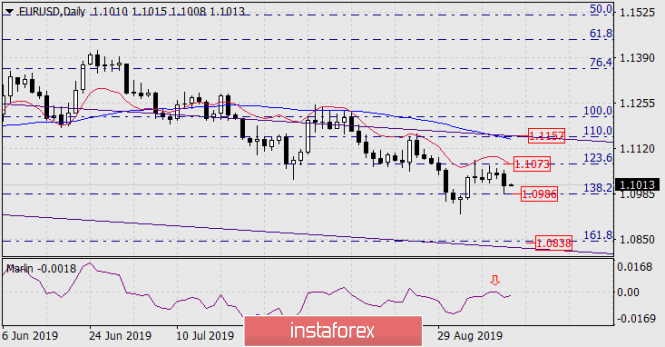
 The euro fell by 57 points on Tuesday, having precisely fulfilled the target level of 138.2% Fibonacci from the base branch of the movement September 24, 2018 – November 12, 2018. The price stayed in the range of two Fibonacci levels, which only increased the intrigue in anticipation of the outcome of the ECB meeting on monetary policy. A reversal of the signal line of the Marlin oscillator from the boundary with the growth territory nevertheless occurred, which became apparent with the closure of the bar. To some extent, this is a signal that the market has raised expectations of any ECB measures sufficient to further reduce the euro.
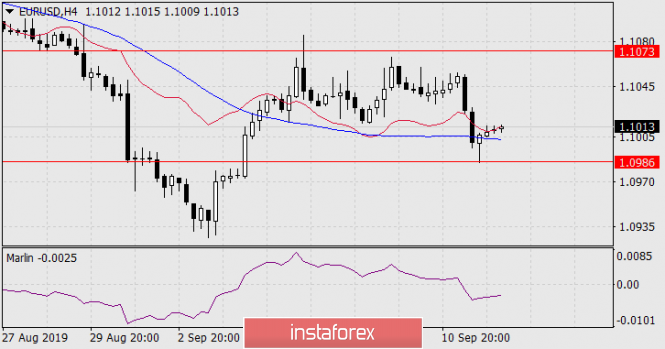
On the four-hour chart, after testing the target level of 1.0986, the price quickly returned above the MACD line, but the leading indicator Marlin confidently penetrated into the decline zone. It remains to wait for the outcome of the ECB meeting and the market reaction to these results, including, of course, comments by Mario Draghi at a subsequent press conference.
So, the main scenario is the option of pulling down the euro to 1.0838 – to the area of the Fibonacci level of 161.8% and supporting the price channel line.
The growth option implies a movement to the previously designated target of 1.1157 – to the point of coincidence of three lines on the daily chart, but after a preliminary overcome of 1.1073 – the Fibonacci level of 123.6%.
Origin: InstaForex