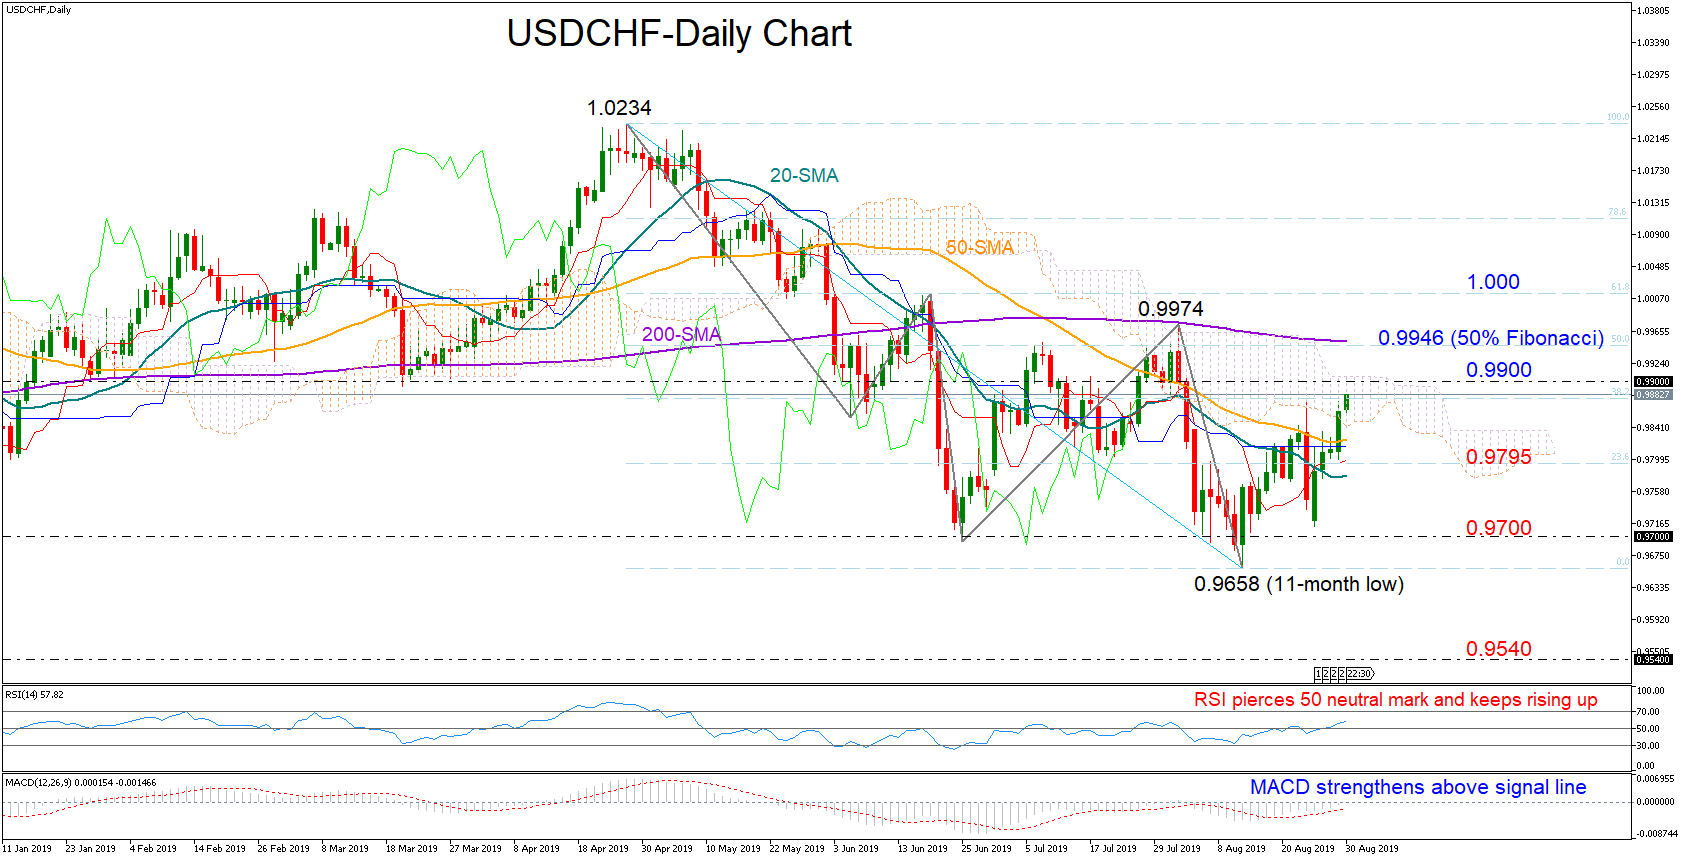
 USDCHF inched up to test the 38.2% Fibonacci of the upleg from 1.0234 to 0.9658 after closing above the 50-day simple moving average (SMA) on Thursday.
In momentum indicators, the RSI has entered bullish territory and is pointing up, while the MACD has further deviated above its red signal line and closer to zero. Both measures are therefore signalling a stronger bullish bias for the short-term.
Nevertheless, traders could wait for a determined exit from the Ichimoku cloud, that blocked the bulls earlier this month, to place higher buying orders. The 200-day SMA which is currently around the 50% Fibonacci of 0.9946 could appear more challenging. Should the rally continue, the 61.8% Fibonacci of 1.000 will be the next target.
In the negative scenario, a reversal to the downside could pause initially near the 23.6% Fibonacci of 0.9795 and then somewhere between the 0.9700 level and the 0.9658 bottom. Beneath the latter, the market would revert to its downward pattern, turning the outlook back to bearish, with the former 0.9540 strong hurdle acting as support to steeper downside movements. If the bears break that border too, the door would open towards 0.9430, where the price energetically rebounded last year and in 2018.
In the medium-term picture, the pair keeps trending downwards, maintaining a bearish profile. An impressive move above the previous peak of 0.9974 would shift the outlook back to neutral.
Summarizing, the short-term outlook is currently viewed positive, though only a decisive close above the Ichimoku cloud could increase buying confidence. In the medium-term, a break above 0.9974 would eliminate the bearish sentiment.
Origin: XM