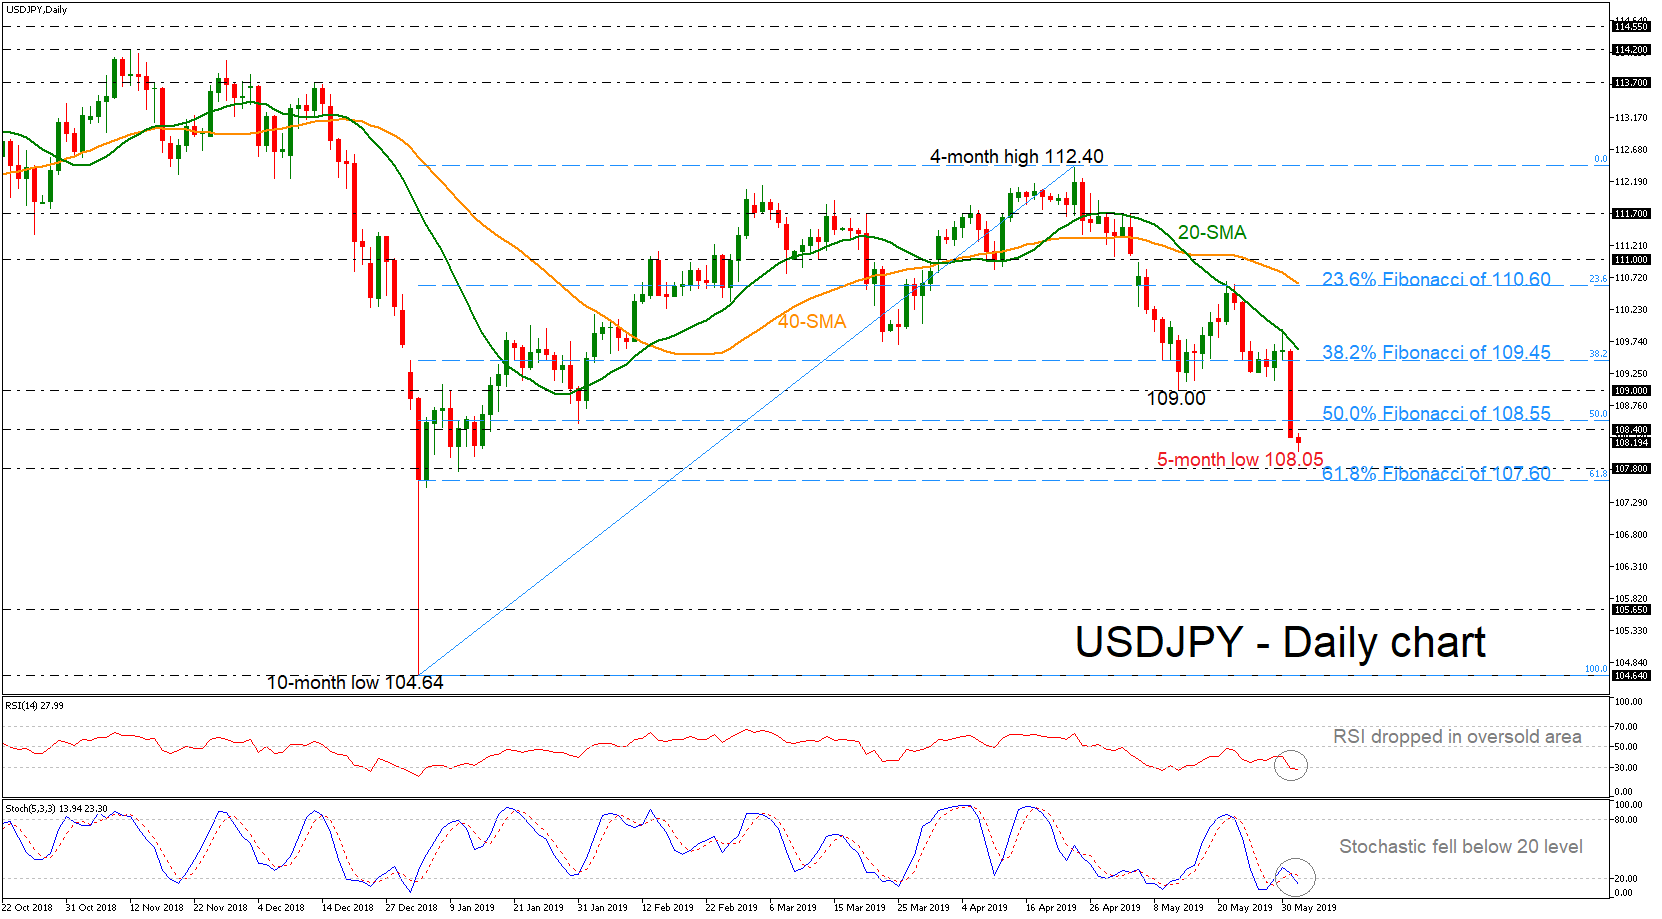
 Since its deep fall towards five-month lows near 108.00 today, USDJPY has been plunging back below the 50.0% Fibonacci retracement level of the upleg from 104.64 to 112.40 near 108.55, creating a base beneath the short-term moving averages. The technical picture supports that the aggressive downfall is likely to continue in the short-term.
The %K line of the stochastic oscillator has fallen sharply into oversold levels and posted a bearish crossover with the %D line. Also, the RSI is dropping below the 30 level, suggesting more downside movement.
If prices continue to head lower, support should come from the 107.80 support and the 61.8% Fibonacci region of 107.60. A drop below this area would reinforce the short-term bearish view and open the way towards the 105.65 barrier, taken from the bottom on April 2018 before edging until the ten-month low of 104.64.
However, should an upside reversal take form, immediate resistance will likely come from the 108.40 – 108.55 zone. A break above these levels could send the market until the 109.00 psychological hurdle before re-challenging the 38.2% Fibonacci of 109.45.
Summarizing, traders should be waiting for a strong rebound before placing positive orders as the recent profile is negative in the near-term. A daily close under the 61.8% Fibonacci (107.80) could endorse the bearish outlook.
Origin: XM