


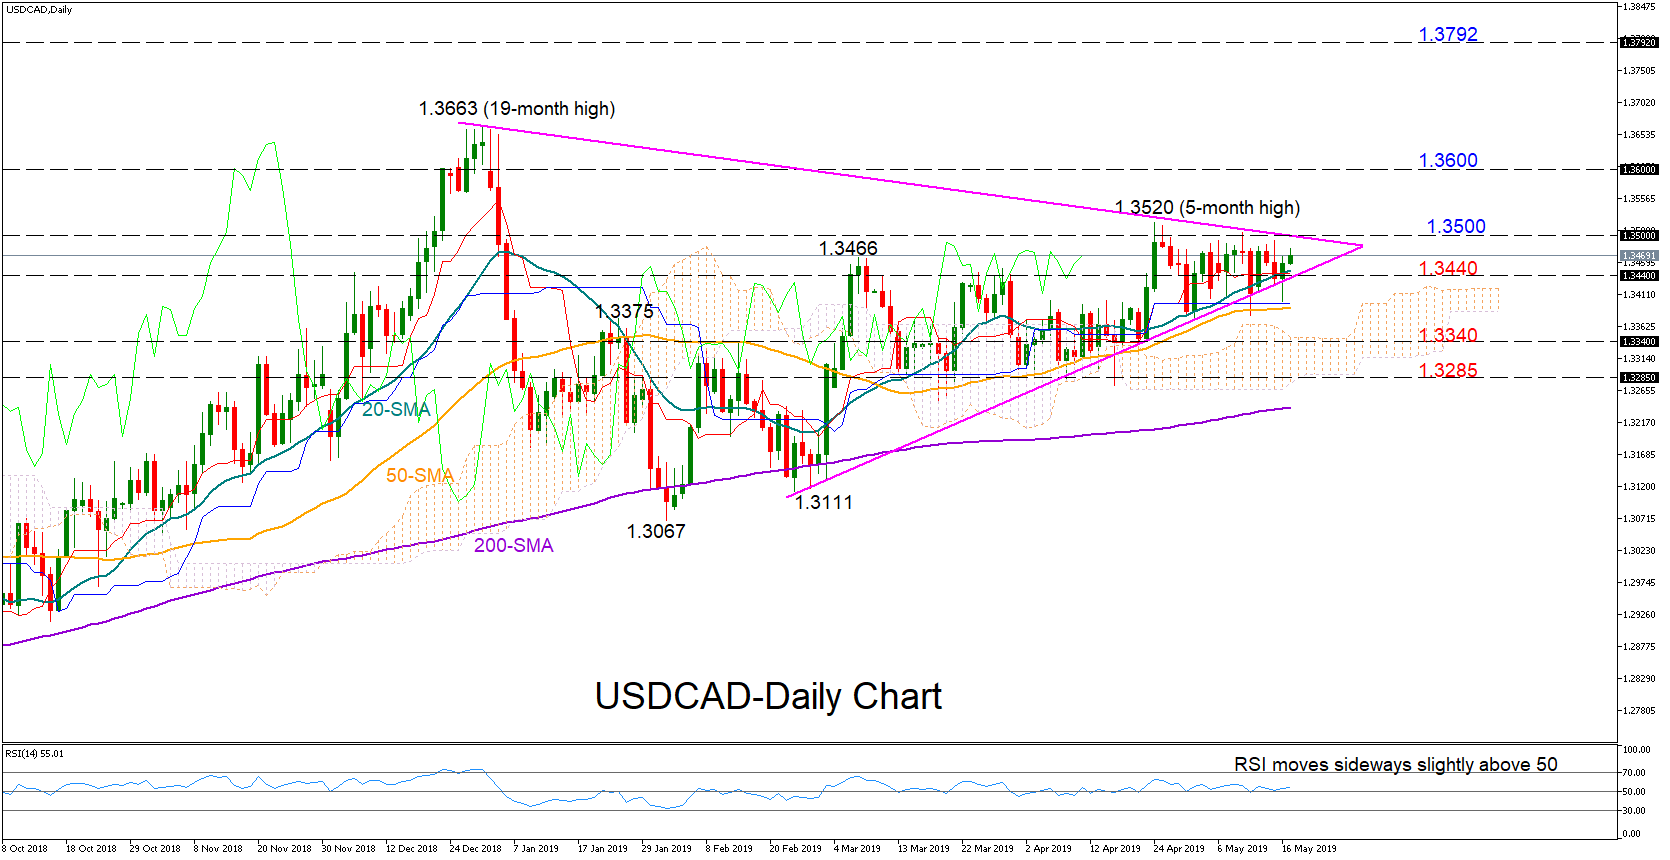
 USDCAD has been range-bound for another week within the 1.3520-1.3375 area, while candles keep closing above the lower line of the symmetrical triangle. The sideway move in the RSI and the flattening Ichimoku indicators (Tenkan-sen, Kijun-sen) signal that the pair may extend its neutral performance in the short term.
On the upside, the price would have to finish a session comfortably above the upper line of the symmetrical triangle (1.3500) for the bullish pressures to heat up. If that is the case, the next key resistance to watch could be somewhere between 1.36 and 1.3663, while higher, attention will shift straight to the 2017 peak of 1.3792.
Investors could start selling the pair more aggressively if the market closes below the triangle (1.3440) and more importantly under the 50-day simple moving average (SMA) currently at 1.3390. Falling lower, the bears would need to beat the 1.3340 mark to reach a stronger support at the bottom of the cloud (1.3285).
Meanwhile in the medium-term picture, USDCAD is trading bullish given the higher highs and the higher lows over the past three months.
Origin: XM


