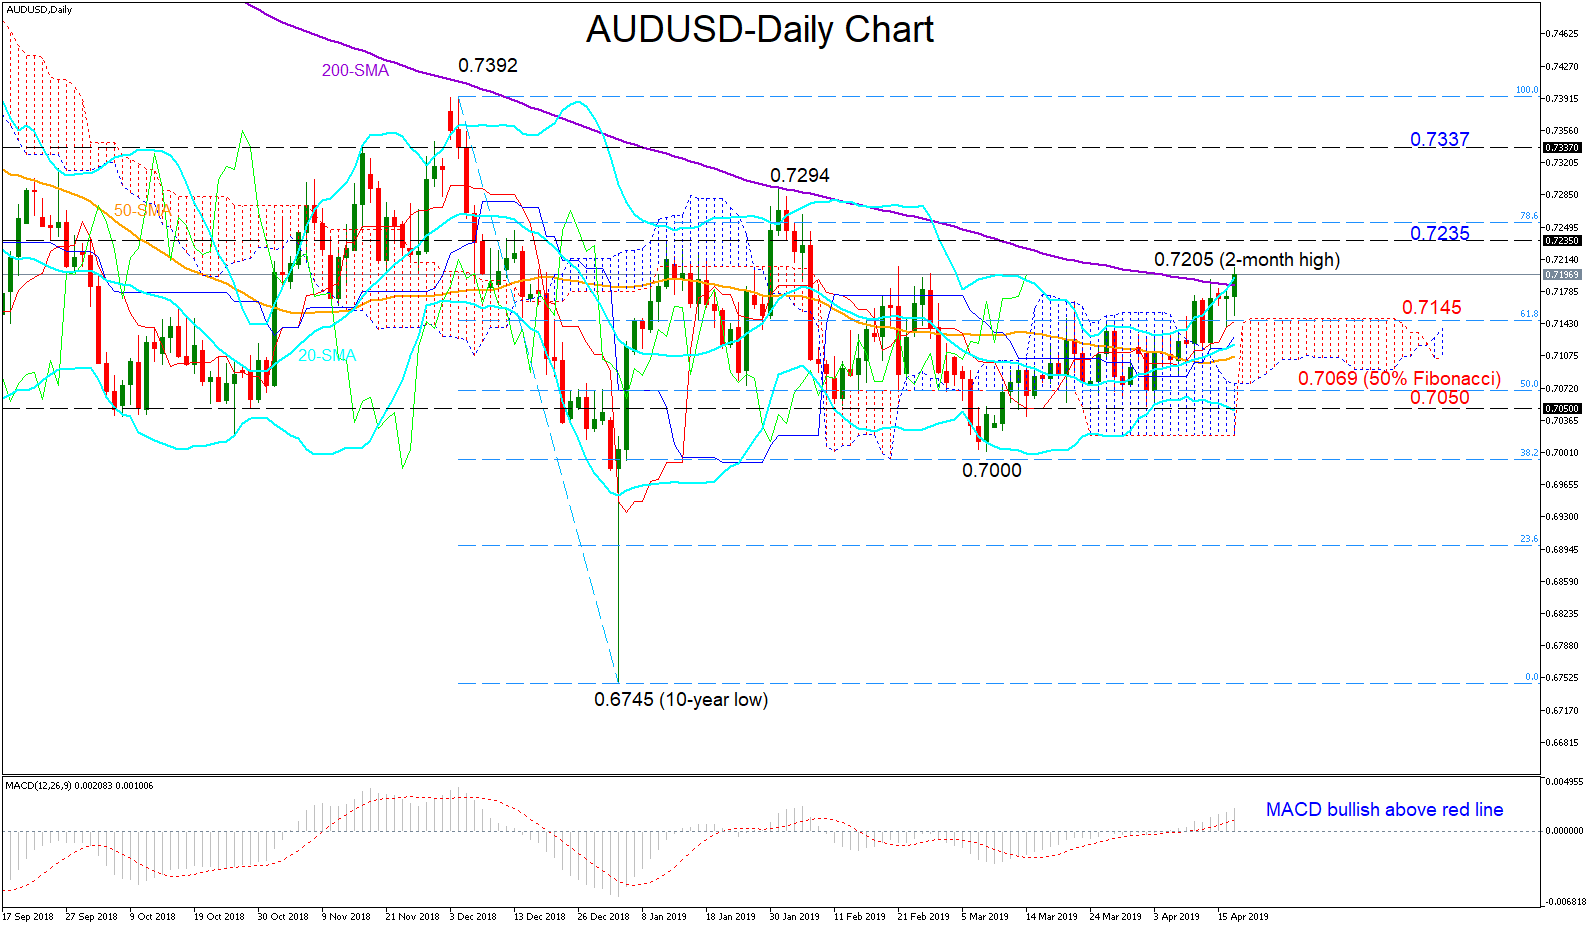
 AUDUSD crawled slightly above the 200-day simple moving average (SMA) early on Wednesday for the first time in more than a year to meet resistance at a two-month high of 0.7205.
Positive momentum could hold in the short term as the red Tenkan-sen line continues to gain ground above the blue Kijun-sen, while the MACD keeps fluctuating comfortably above its red trigger line. At the same time, the pair is also trading along the upper Bollinger band over the past few days, warning that room for improvement may be limited in the short term. Therefore, the bias could be currently viewed as cautiously bullish.
Another leg higher might potentially find resistance near 0.7235 before the spotlight turns to the 0.7294 peak. Higher, the market will probably need to overcome the 0.7337 barrier to take positive perspectives to the next level. The latter would also add some life to the uptrend paused at 0.7392 in December.
The red Tenkan-sen line currently at 0.7145 has been strictly supportive over the past week and therefore should be closely watched if the bears retake control. Breaking that obstacle, the price may extend the decline towards the 0.7069-0.7050 area, where the 50% Fibonacci of the downleg from 0.7392 to 0.6745 is positioned. Further down, any close below 0.7000 would reactivate the downtrend off 0.7392, resuming the bearish profile in the medium-term picture.
In brief, AUDUSD is in bullish mode in the short term, while in the medium term, neutral conditions are still intact as long as the price trades between 0.7000 and 0.7294.
Origin: XM