


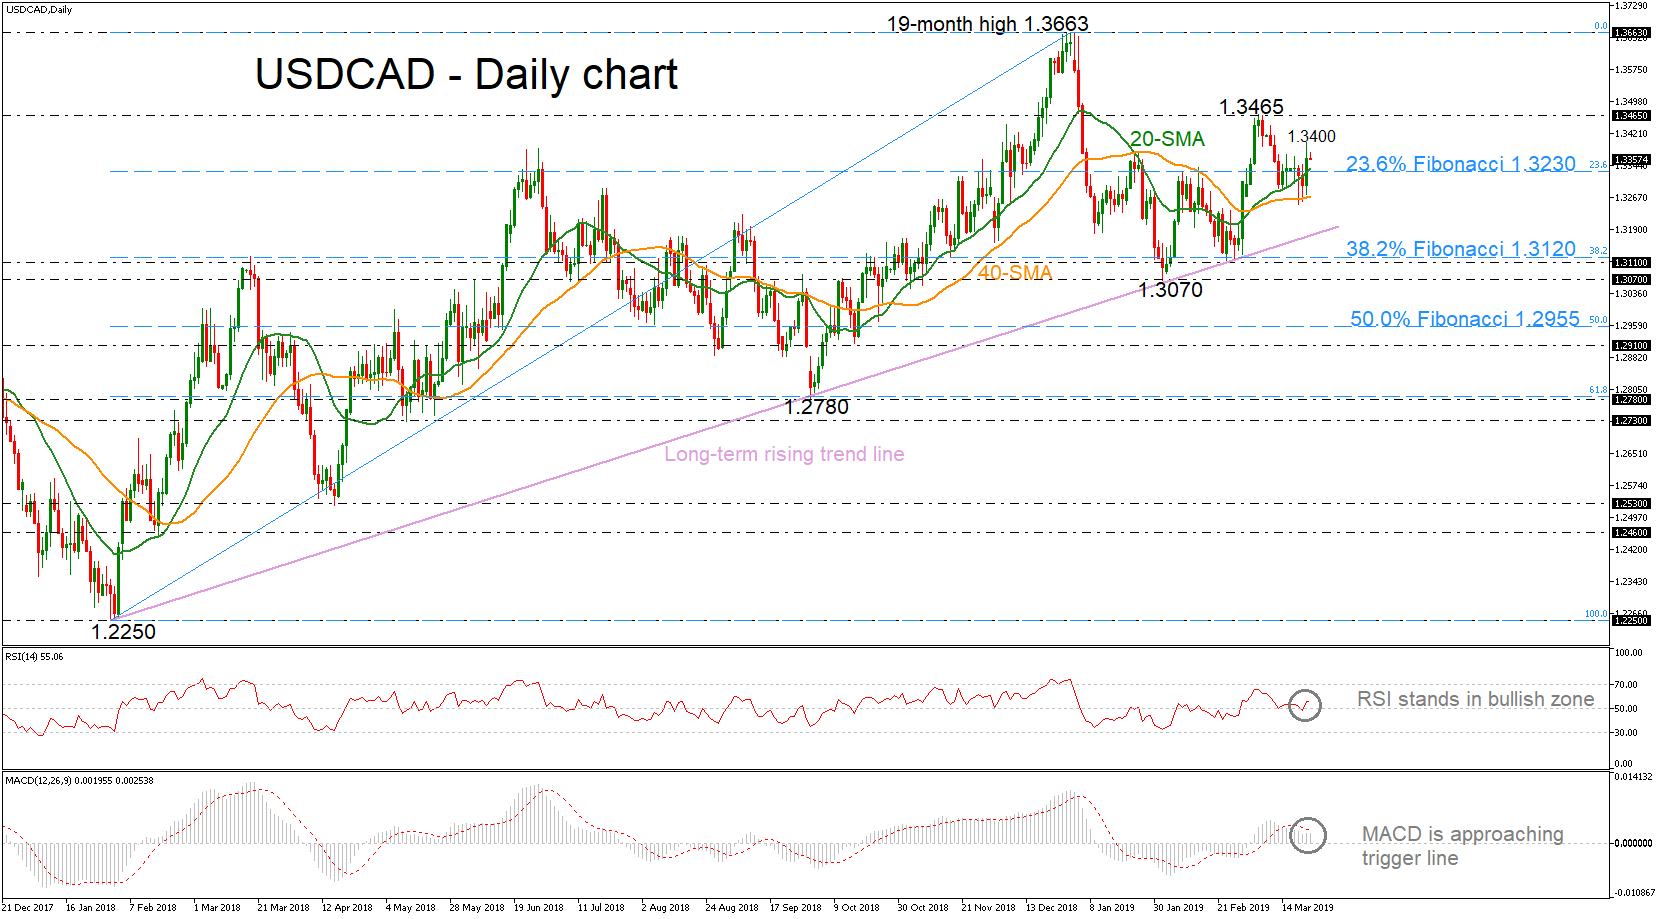
 USDCAD is stretching its positive momentum above the 23.6% Fibonacci retracement level of the upleg from 1.2250 to 1.3663, near 1.3230 and the 20- and 40-simple moving averages (SMAs) in the daily timeframe. During yesterday’s session, the pair touched the 1.3400 handle, but failed to hold those gains and returned to slightly lower figures. Currently, the price remains strongly bullish in the long-term, touching the ascending trend line several times and pushing the price even higher.
Returning to the near term, the technical indicators seem to be neutral to bullish. The RSI is holding above the neutral threshold of 50, while the MACD is in progress to complete a positive crossover with its trigger line.
The immediate resistance of 1.3465 could be a trigger point for steeper bullish action if the pair manages to continue its upside tendency. More advances could drive the price until the 19-month high of 1.3663, though more buyers could be waiting for a daily close above this level to initiate additional long positions.
Overall, in the long-term timeframe, the market has been developing in an upside movement since February 2018, completing higher highs and higher lows.
Origin: XM


