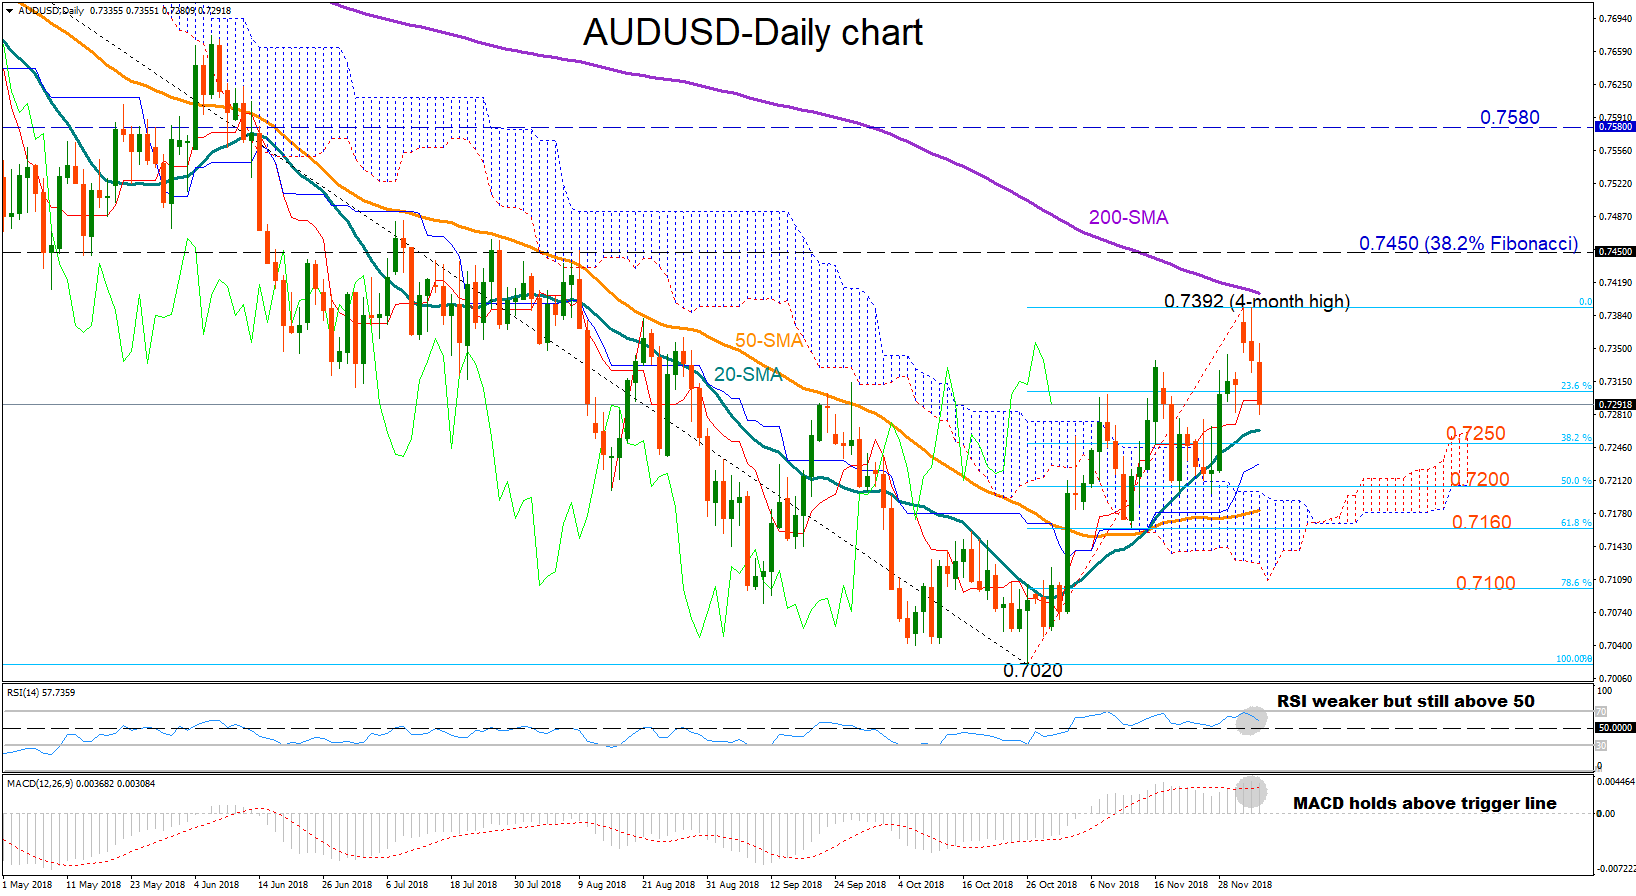
 AUDUSD reached overbought levels according to the RSI and reversed lower just before touching the 200-day simple moving average (SMA) on the daily chart, creating a new peak at 0.7392, a four-month high.
While the aforementioned technical indicator continues to slow down, mirroring the market’s bearish behavior over the past three days, the indicator is still moving in bullish territory, flagging that a recovery could reemerge in the short term. The MACD is also holding above its red signal line, which supports the bullish view as well, while the 20-day SMA keeps increasing its distance above the 50-day SMA, suggesting that the recent uptrend is likely to stay in place for now.
In case the pair changes its short-term direction to the upside, the bulls will probably challenge the previous top at 0.7392. A break higher, could last until 0.7450, the 38.2% Fibonacci of the downleg from 0.8135 to 0.7020, which provided both support and resistance in the past. Further up the area around 0.7580 could be another potential obstacle for upward movements.
Alternatively, additional declines may drive the price towards the 38.2% Fibonacci retracement of the rebound from 0.7020 to 0.7392, near 0.7250, before the 50% Fibonacci of 0.7200 comes into view. Beneath the latter, the 61.8% Fibonacci of 0.7160, which rejected the market’s actions recently could be another level in focus ahead of the 0.7100 psychological mark.
Turning to the medium-term picture, the pair switched to neutral mode after the rally off 0.7020. The 50-day SMA looks to be slowly strengthening and given that the 200-day SMA continues to head south, the market’s outlook might improve further in the medium-term. Yet there is still some way to go for the lines to meet each other.
Summarizing, AUDUSD maintains a bullish bias in the short term picture, whereas in the medium-term it holds a neutral profile.
Origin: XM