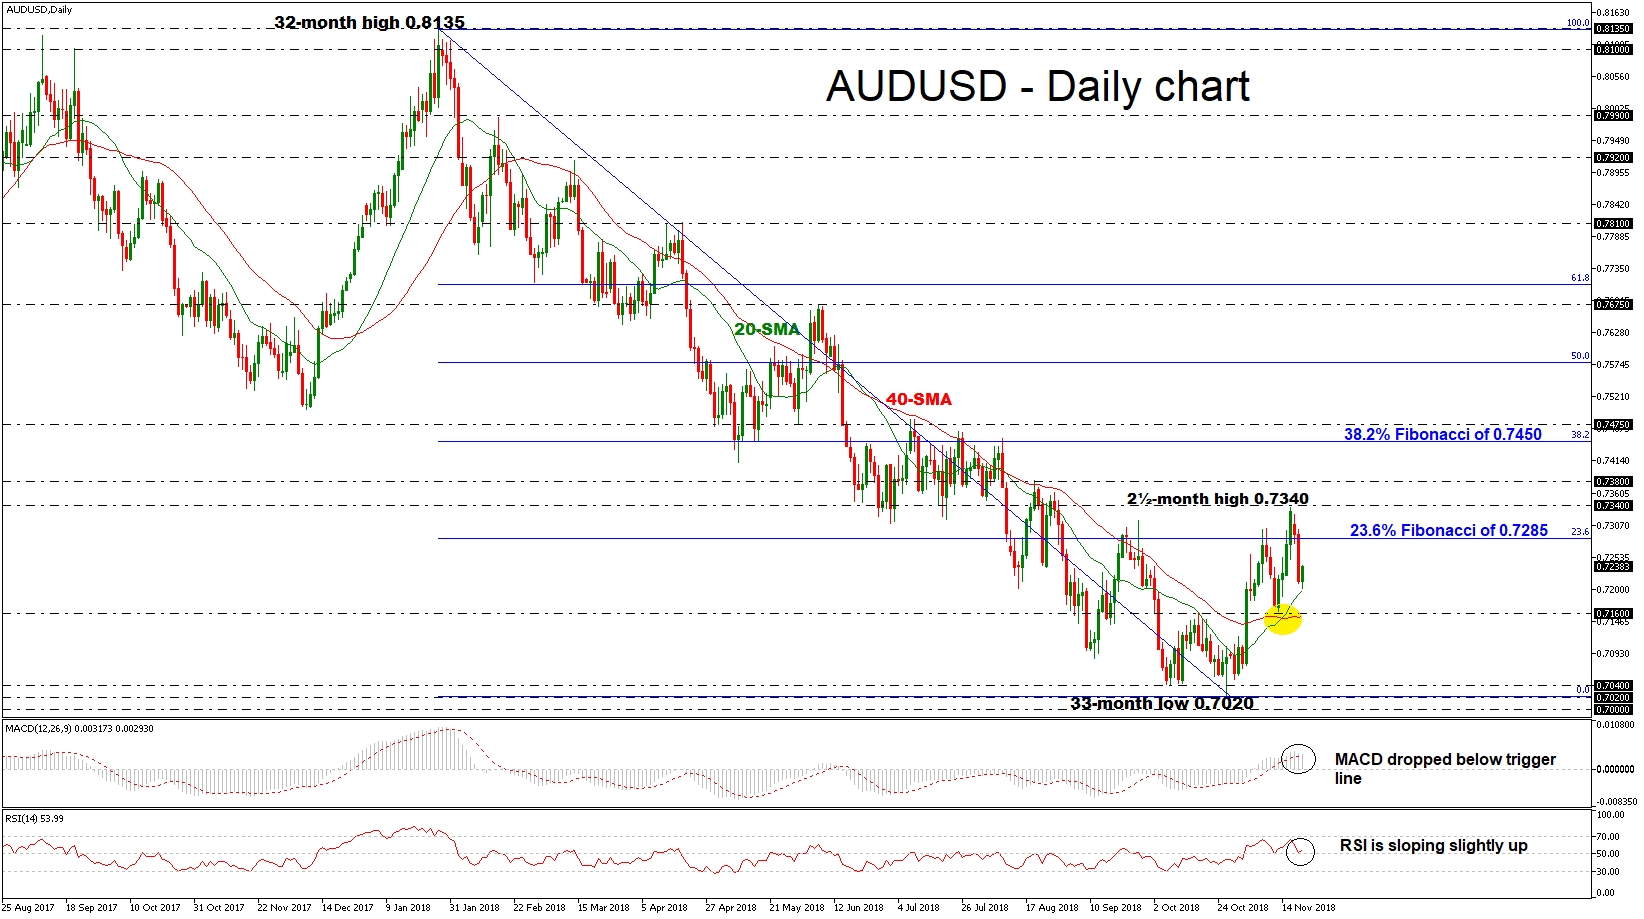
 AUDUSD turned negative over the last two consecutive days after its downfall from the two-and-a-half-month high near 0.7340, reached last Friday. The price started the day in bullish territory finding support around the 20-day simple moving average (SMA) around 0.7200. In the short-term, the technical indicators remain in the bullish area with the RSI pointing slightly up, however, the MACD oscillator dipped below the trigger line.
On the upside, the 23.6% Fibonacci retracement level of the strong downward movement from 0.8135 to 0.7020, near 0.7285 could be the next immediate resistance for investors to have in mind. Beyond this region, resistance could then run towards the 0.7340 – 0.7380 zone before the 38.2% Fibonacci of 0.7450 comes under the radar.
Alternatively, should the price head south, it would be interesting to see if the SMAs can stop downside movements. A fall below the 20-day SMA could drive the pair until 0.7160, which hovers near the 40-day SMA. However, if these SMAs fail to hold, the market could drop below the latest low in order to meet the 0.7000 – 0.7040 significant support area, which encapsulates the 33-month low of 0.7020.
Regarding the medium-term picture, the market penetrated the falling trend line to the upside, during the previous couple of weeks and is expected to post a strong bullish correction. However, the bullish phase could fade out if the price falls below 0.7160.

Origin: XM


